Fig. 13
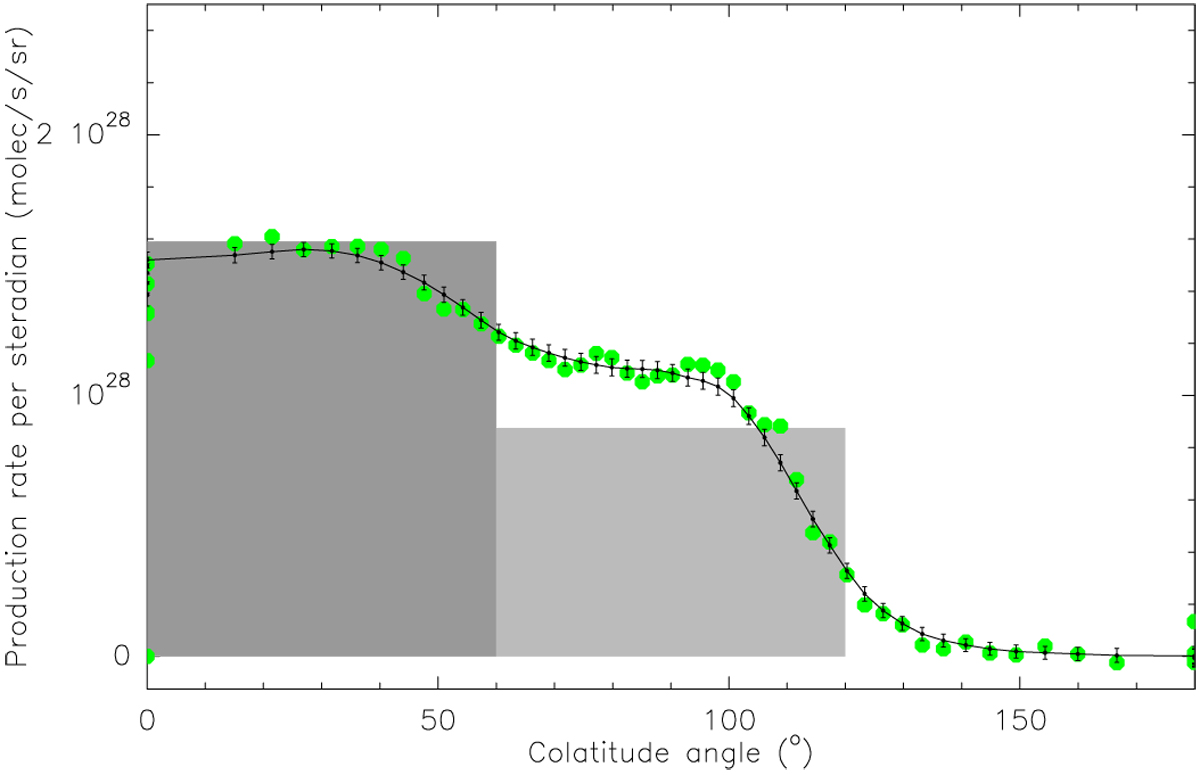
Inversion of the CO(2–1) line profile from Fig. 3, assuming a constant expansion velocity of 0.56 km s−1. The production rate per steradian is derived as a function of the colatitude angle (ϕ = 0° on the Earthside, 180° on the opposite), assuming symmetry along the Comet-Earth line. The dots correspond to the values derived for each spectral channel and the connected line with error bars is the running average taking into account thermal broadening. The grey shaded region corresponds to the production rate profile used to determine the total production rates, with vexp =0.56 and 0.50 km s−1 in the dark and light grey regions, respectively (see text).
Current usage metrics show cumulative count of Article Views (full-text article views including HTML views, PDF and ePub downloads, according to the available data) and Abstracts Views on Vision4Press platform.
Data correspond to usage on the plateform after 2015. The current usage metrics is available 48-96 hours after online publication and is updated daily on week days.
Initial download of the metrics may take a while.