Fig. 10
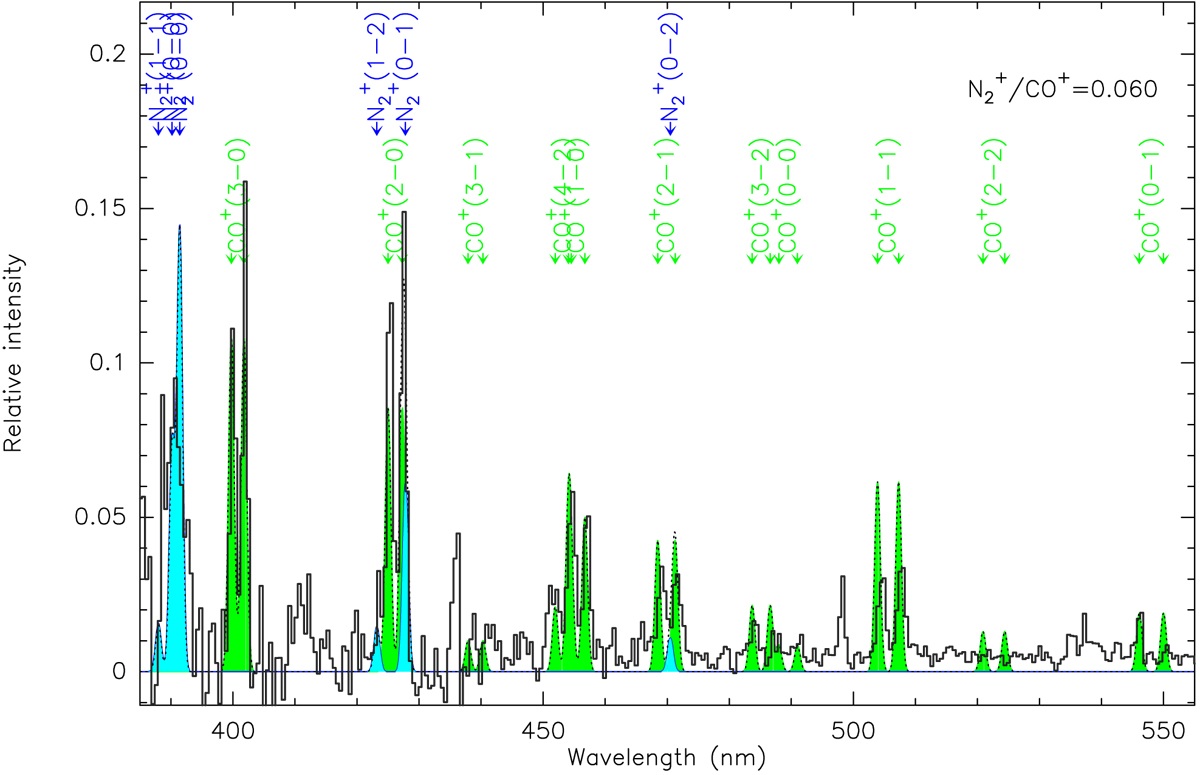
Black line: visible spectrum of comet C/2016 R2 (PanSTARRS) obtained by H. Boussier on 22.92 December 2017 UT (40 min integration) from MPC station K21. The spectrum was extracted from the central 10 (binned) pixels rows. Green filled lines represent the simulated CO+ spectrum with respective average g-factors. Blue filled lines show the N![]() spectrum fora N
spectrum fora N![]() /CO+ column density ratio of 0.06. The vertical intensity scale has been normalized. The dotted line is the sum of N
/CO+ column density ratio of 0.06. The vertical intensity scale has been normalized. The dotted line is the sum of N![]() and CO+ synthetic spectra. The signal towards the red end (>500 nm) of the spectrum is likely under-corrected because the LISA spectrometer is not optimised to cover the full wavelength range and the comet was slightly out of focus in that part of the spectrum. As a consequence, the signal of the lines beyond ~510 nm is lower than expected and some lines are not detected. This part of the spectrum is not used in the analysis.
and CO+ synthetic spectra. The signal towards the red end (>500 nm) of the spectrum is likely under-corrected because the LISA spectrometer is not optimised to cover the full wavelength range and the comet was slightly out of focus in that part of the spectrum. As a consequence, the signal of the lines beyond ~510 nm is lower than expected and some lines are not detected. This part of the spectrum is not used in the analysis.
Current usage metrics show cumulative count of Article Views (full-text article views including HTML views, PDF and ePub downloads, according to the available data) and Abstracts Views on Vision4Press platform.
Data correspond to usage on the plateform after 2015. The current usage metrics is available 48-96 hours after online publication and is updated daily on week days.
Initial download of the metrics may take a while.