| Issue |
A&A
Volume 619, November 2018
|
|
|---|---|---|
| Article Number | A92 | |
| Number of page(s) | 10 | |
| Section | Atomic, molecular, and nuclear data | |
| DOI | https://doi.org/10.1051/0004-6361/201833267 | |
| Published online | 12 November 2018 | |
The millimeter-wave spectrum of methyl ketene and the astronomical search for it★
1 Université de Lille, Faculté des Sciences et Technologies, Département Physique, Laboratoire de Physique des Lasers, Atomes et Molécules, UMR CNRS 8523, 59655 Villeneuve d’Ascq Cedex, France
e-mail: This email address is being protected from spambots. You need JavaScript enabled to view it.
2 Observatorio Astronómico Nacional (IGN), C/Alfonso XII 3, 28014 Madrid, Spain
3 Instituto de Física Fundamental, Dpt. of Molecular Astrophysics, CSIC, C/ Serrano 121, 28006 Madrid, Spain
4 Sorbonne Université, CNRS, Laboratoire de Chimie Théorique, LCT, 75005 Paris, France
5 Univ. Rennes, Ecole Nationale Supérieure de Chimie de Rennes, CNRS, ISCR – UMR6226, 35000 Rennes, France
Received:
19
April
2018
Accepted:
11
July
2018
Abstract
Context. The analysis of isomeric species of a compound observed in the interstellar medium (ISM) is a useful tool to understand the chemistry of complex organic molecules. It could, likewise, assist in the detection of new species.
Aims. Our goal consists in analyzing one of the two most stable species of the C3H4O family, methyl ketene, whose actual rotational parameters are not precise enough to allow its detection in the ISM. The obtained parameters will be used to search for it in the high-mass star-forming regions Orion KL and Sagittarius B2, as well as in the cold dark clouds TMC-1 in the Taurus Molecular Cloud and Barnard 1 (B1–b).
Methods. A millimeter-wave room-temperature rotational spectrum of methyl ketene was recorded from 50 to 330 GHz. The internal rotation analysis of its ground state and first torsional excited state was performed with the rho-axis method employing the RAM36 program.
Results. More than 3000 transitions of the rotational spectrum of the ground state (Kamax = 18) and first torsional excited state (Kamax = 13) of methyl ketene were fitted using a Hamiltonian that contains 41 parameters with a root mean square of 44 kHz. Column density limits were calculated but no lines were detected in the ISM belonging to methyl ketene.
Key words: ISM: molecules / methods: laboratory: molecular / submillimeter: ISM / molecular data / line: identification
Full Tables 2 and 3 are only available at the CDS via anonymous ftp to cdsarc.u-strasbg.fr (130.79.128.5) or via http://cdsarc.u-strasbg.fr/viz-bin/qcat?J/A+A/619/A92
© ESO 2018
 Open Access article, published by EDP Sciences, under the terms of the Creative Commons Attribution License (http://creativecommons.org/licenses/by/4.0), which permits unrestricted use, distribution, and reproduction in any medium, provided the original work is properly cited.
1. Introduction
A fundamental question in astrophysics and astrochemistry yet to be answered is to understand molecular complexity in space. As a result of vast scientific efforts, ∼200 different chemical species have been detected in the interstellar medium (ISM). Among them, one can find several complex organic molecules (COMs) under diverse environments, meaning by COMs carbon-based molecular species with more than six atoms in their structure (Herbst & van Dishoeck 2009). COMs up to 13 atoms have been detected in the ISM containing a large variety of functional groups, including alcohols, ketones, or aldehydes (Endres et al. 2016). The most abundant sources of these COMs are the giant molecular clouds of the Galactic Center (Requena-Torres et al. 2006; Hollis et al. 2006b) as well as high-mass hot cores (Ikeda et al. 2001; Remijan et al. 2004; Belloche et al. 2013; Tercero et al. 2013, 2015) and low-mass hot corinos (Bottinelli et al. 2007; Jørgensen et al. 2016) of star-forming regions. However, the detection of COMs has been recently extended to dark cloud cores and pre-stellar cores (see, e.g., Cernicharo et al. 2012; Jiménez-Serra et al. 2016; McGuire et al. 2018).
Notwithstanding the advances in this field, the synthetic routes of COMs are still far from being fully understood; the creation of reliable models is particularly challenging in sources like Sgr B2(N) (Quan & Herbst 2007), which, is one of the major sources of COMs. Hollis et al. (2006a) pointed out that the observation of molecular isomers provides an excellent tool to evaluate the hypothesis of synthetic pathways. More recently, after evaluating several groups of molecular isomers, Lattelais et al. (2009, 2010, 2011) proposed the “minimum energy principle” (MEP). They stated that the thermodynamically most stable isomer of a molecular formula is practically the most abundant in the ISM. If so, this principle would constitute a pragmatic tool to propose new candidates for the ISM.
Continuing the isomeric analysis, in the present paper we will focus on the C3H4O family. The most stable isomers C3H4O are propenal (also known as acrolein), methyl ketene (1-propen-1-one), and cyclopropanone (Karton & Talbi 2014). So far, only a tentative detection of propenal has been reported towards Sgr B2(N) employing the Green Bank telescope (Hollis et al. 2004), where they observed the two transitions that were in the observational frequency range but the detection of propenal has never been confirmed by independent observations. A more recent work in the millimeter frequency range (Daly et al. 2015) provides a comprehensive spectroscopic analysis that could allow us to detect further transitions. Nevertheless, the main issue of the analysis of this group of isomers is the lack of precise information about the spectroscopy of methyl ketene, which prevents not only its detection in the ISM but also the development of models that explain the behavior of the isomeric C3H4O family in the ISM. The latest rotational parameters for methyl ketene were published by Bak et al. (1962, 1966) in the 1960s where they reported the analysis up to J = 3 and Ka = 2 in the 16–27 GHz frequency range. These values do not allow a precise extrapolation to the ISM observational frequency range. Since its homologue, ketene (H2CCO), was detected a long time ago (Turner 1977) and provided that its isomer acrolein is also likely to be present in the ISM, we investigate the rotational spectrum of methyl ketene in order to facilitate its detection in the ISM.
2. Computational calculations
Our own high level ab initio calculations were performed with the aim of comparing the energetic ratios between the lower energy C3H4O isomers: propenal (antiperiplanar rotamer, ap), methyl ketene, propenal (synperiplanar rotamer, sp), cyclopropanone, oxetene, 2-methyleneoxirane, 1-propynol, 2-propynol, 2-methyloxirene, 2-cyclopropen-1-ol, 1-cyclopropen-1-ol, allenol, and methoxyacetylene. The coupled cluster method CCSD(T) was employed together with Dunning basis sets aug-cc-pVTZ as implemented in MOLPRO software (Werner et al. 2015). A summary of the results is presented in Fig. 1. Three species, methyl ketene and both rotamers of propenal, were found to be the most stable, around 80 kJ mol−1 below cyclopropanone, the following isomer on the energy scale.
Within the three most stable species, methyl ketene is the only one whose spectroscopic parameters that could allow its detection in the ISM remain unknown. In order to assist the spectroscopic analysis of methyl ketene, anharmonic force field calculations were carried out (Frisch et al. 2016) at the MP2/aug-cc-pVTZ level of theory. The complete set of rotational constants, distortional constants, structure, and internal rotation parameters, including the barrier height, can be found in Table A.1. The CH3 internal rotation barrier height is estimated at 424 cm−1, which is in a good agreement with the value of 411 ± 7 cm−1 obtained by Bak et al. (1966).
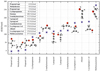 |
Fig. 1. Relative energy of C3H4O isomers calculated at CCSD(T)/aug-cc-pVTZ level of theory. |
At the MP2/aug-cc-pVTZ level of theory, the calculations of vibrational excited states’ energies establish that methyl ketene has two low-frequency vibrational modes: the methyl group torsion (v18 = 1, A″) that has a fundamental frequency of 133.4 cm−1, and skeletal in-plane bending in (v12 = 1, A′) at 202 cm−1. The value obtained for v18 = 1 is consistent with the corresponding value estimated by Winther et al. (2002) in the infrared (IR) experiments (135.6 ± 1 cm−1).
3. Experiments
The methyl ketene sample was obtained by pyrolysis of propionic anhydride, which was purchased from Aldrich and used without further purification. Flash vacuum pyrolysis at 600∘C produces methyl ketene together with propanoic acid. The latter was easily removed by selective condensation in a trap immersed in a −70∘C cold bath. A gaseous flow of pure methyl ketene was thus obtained and analyzed by means of millimeter-wave spectroscopy.
The millimeter-wave spectrum of methyl ketene has been recorded between 50–330 GHz at room temperature and at a pressure of 0.028 mbar using the Lille spectrometer described by Zakharenko et al. (2015), which was recently equipped with a fast-scan mode. This new fast-scan design is able to provide a rapid frequency scan with up to 50 μs/point-of-frequency switching rate. It employs an AD9915 direct digital synthesizer (DDS) up-converted into Ku band. The up-conversion is achieved by mixing the DDS output signal in the frequency range 320–420 MHz, and the signal from an Agilent E8257 synthesizer (up to 20 GHz) with subsequent filtering of the upper sideband in a YIG bandpass filter. Thus, the fast frequency scan is provided by sweeping the DDS within the filter bandwidth of 25–40 MHz. The up-converted signal is then multiplied by factor of six into W-band (75–110 GHz) using an active multiplier AMC-10 from VDI (Virginia Diodes, Inc). The output power of AMC-10 is enough to drive passive Schottky multipliers from VDI on the next stage of frequency multiplication: a doubler (150–220 GHz) and a tripler (225–330 GHz). In addition, AMC-10 may be used as a radiation source in W-band. The detection was carried out employing a series of Schottky diode zero biased detectors from VDI: WR10ZBD (75–110 GHz), WR5.1ZBD (150–220 GHz), and WR3.4ZBD (225–330 GHz). The 50–75 GHz range was covered employing a Millitech active multiplier by factor four and the corresponding solid state detector WR15ZBD.
4. Analysis of the spectra
Methyl ketene is a near prolate molecule that has a planar molecular skeleton with only two hydrogen atoms of the methyl group out of the plane, thus it has Cs species at equilibrium. Due to the coupling of internal rotation of the methyl group (CH3) and the overall rotation of the molecule, the rotational levels are split into 𝒜/ℰ. One should note that methyl ketene is characterized by a relatively high value of the ρ parameter (ρ = 0.196) that describes this coupling. The ρ parameter corresponds to the norm of the so-called ρ vector, whose coordinates are calculated using the expression

where λg are the direction cosines of the internal rotation axis of the top in the principal axis system, Ig are the principal moments of inertia, and Iα is the moment of inertia of the methyl top.
In terms of the ρ value, methyl ketene may be considered as an intermediate case between acetaldehyde CH3CHO ρ = 0.328 (Smirnov et al. 2014) and acetic acid CH3COOH ρ = 0.072 (Ilyushin et al. 2013) or methyl formate CH3OCHO, ρ = 0.084 (Ilyushin et al. 2009). For all these molecules, accurate analysis of the large-amplitude torsional motion was performed using the rho-axis method (RAM). Therefore, RAM was applied in the present study of methyl ketene. The method uses the axis system obtained by rotation of the principal axis system to align with the new z axis parallel to the ρ vector. For prolate rotors with a plane of symmetry, the new axis system is obtained via rotation of the principal axes in the (ab) plane by angle θRAM:

The RAM Hamiltonian may be written as (Kleiner 2010)
 (1)
(1)
where HT represents the torsional Hamiltonian defined as
 (2)
(2)
where F is the internal rotation constant, pα is the internal rotation angular momentum conjugate to the torsion angle α, and V(α) is the internal rotation potential function expanded into
 (3)
(3)
The HR represents rigid rotor rotational Hamiltonian in the rho-axis system. In addition to the usual A, B, and C terms, for the molecules with a plane of symmetry (𝓍𝓏) (as is appropriate for methyl ketene) it contains a non-diagonal term Dxz. In the Ir coordinate representation, HR has the form
 (4)
(4)
The last two terms in the Eq. (3), Hcd and Hint, are the usual centrifugal distortion and higher-order torsional-rotational interaction Hamiltonians, respectively.
For fitting and predicting the rotational spectra, we used the RAM36 (rho-axis method for three- and six-fold barriers) program that allows us to include in the model almost any symmetry-allowed torsion-rotation Hamiltonian term up to the twelfth order (Ilyushin et al. 2010, 2013). The RAM Hamiltonian in the Eq. (1) may be expressed in the following form used in the RAM36 program:
![Mathematical equation: $$ \begin{array}{*{20}{l}}{H = \frac{1}{2}}&{\mathop \sum \limits_{knpqrs} {B_{knpqrs0}}\left[ {{J^{2k}}J_z^nJ_x^pJ_y^qp_\alpha ^r\cos (3s\alpha )} \right.}\\{}&{\left. { + \cos (3s\alpha )p_\alpha ^rJ_y^qJ_x^pJ_z^n{J^{2k}}} \right]}\\{}&{ + \frac{1}{2}\mathop \sum \limits_{knpqrt} {B_{knpqr0t}}\left[ {{J^{2k}}J_z^nJ_x^pJ_y^qp_\alpha ^r\sin (3t\alpha )} \right.}\\{}&{\left. { + \sin (3t\alpha )p_\alpha ^rJ_y^qJ_x^pJ_z^n{J^{2k}}} \right],}\end{array}\ $$](/articles/aa/full_html/2018/11/aa33267-18/aa33267-18-eq7.gif) (5)
(5)
where the Bknpqrst are fitting parameters. Methyl ketene is characterized as a molecule having a Cs frame and a C3v top. Therefore the allowed terms in the torsion-rotation Hamiltonian must be totally symmetric in the molecular symmetry group G6 (and also must be Hermitian and invariant to the time reversal operation). Since all individual operators pα, Jx, Jy, Jz, J2, cos(3sα), and sin(3tα) used in Eq. (5) are Hermitian, all possible terms provided by Eq. (5) will automatically be Hermitian. The particular term to be fit is represented in the input file with a set of k, n, p, q, r, s, t integer indices that are checked by the program for conformity with time reversal and symmetry requirements to prevent accidental introduction of symmetry-forbidden terms into the Hamiltonian. For example, B0200000 corresponds to ARAM in Eq. (4), B0000200 to F in Eq. (2), B0110000 to 2Dab in Eq. (4), and so on. In Table 1, which presents the final set of molecular parameters, instead of Bknpqrst, we give more conventional names for the parameters whose nomenclature is based on the subscript procedures of Xu et al. (2008). Further details on the Hamiltonian employed can be seen from the operators presented in Table 1.
Methyl ketene molecular parameters of ground state and torsional mode ν18 obtained from the fit using RAM36 program (A-reduction, ℐr-representation).
We started our analysis of methyl ketene by refitting 16 transitions involving low J and Ka quantum numbers reported by Bak et al. (1962, 1966) using the RAM36 code. The RAM model is highly non-linear and strongly depends on the dataset of assigned transitions. In the initial fit, owing to the limited number of transitions from previous studies, the F and ρ parameters from the torsional Hamiltonian (Eq. (2)) were fixed to the values determined from the rs structure of methyl ketene (Bak et al. 1966). Following the fit of previously reported transitions, initial frequency predictions were obtained. Not surprisingly, the predictions could only be reliable for the lower frequency range and low values of J and Ka. For example, the analysis of the data of Bak et al. (1962, 1966) predicts 𝒜 symmetry transition 250 25 ← 240 24 at 210496.3 MHz, whereas the experimental value is 210746.8 MHz, which differs by about 250 MHz. Nevertheless, the initial predictions were useful in the assignment of millimeter-wave spectra.
Figure 2a, represents the experimental spectrum of methyl ketene in the frequency range 225–305 GHz measured in this study. At first glance, groups of aR0, 1 transitions separated by ∼8900 MHz may be observed. The separation between groups corresponds approximately to the value of B + C for an a-type spectrum of a quasi prolate molecule like methyl ketene, and it provides the assignment of the J quantum number within each group. In this way, using the results of our theoretical calculations, predictions obtained on the basis of the refit results of previous studies, and broadband spectra suitable for building Loomis-Wood diagrams, we iteratively assigned and analyzed the rotational spectrum of methyl ketene.
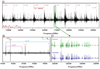 |
Fig. 2. Sections of the methyl ketene rotational spectrum. |
The advantage of the RAM is its capacity for a global treatment of all excited vibrational states associated with the methyl torsion. Using the results of the fit of the ground-state transitions, we were able to predict the transitions of the v18 = 1 state within a few MHz. In the same manner, we were able to obtain rather accurate predictions for the v18 = 2 state on the basis of the results of the global fit of the v = 0 and v18 = 1 states. Looking closely at the spectra (see Fig. 2b), we observed several satellites around the ground state, which belong to vibrational excited states. After scaling the rotational constants of the vibrational excited states by a correction factor obtained from the experimental and calculated ground-state values, we were able to assign several series of rotational transitions of the v12 = 1 state.
The global fit of the v18 = 0, 1, and 2 states was a very lengthy task as it required a much higher number of parameters that led to strong correlations, and unrealistic values of the main torsional parameters such as F, V3, and ρ. To address this issue, we built a reduced energy diagram presented in Fig. 3. The diagram represents the reduced energy Ered of each rotational state as a function of J quantum number. It is calculated according to the equation Ered(cm−1)=E − J(J + 1)(B + C), where E corresponds to the energy of rotational level predicted either on the basis of global fit or quantum chemical calculations. Each line on the diagram represents a stack of levels with the same Ka quantum number. The analysis of the diagram shows that starting from the energy of 300 cm−1 the density of levels is significantly increased. For example, around 400 cm−1 the rotational levels of different vibrational states with close Ka values are embedded into a narrow energy zone. Thus, taking into account the proximity in energy of v18 = 2 and v12 = 1 and their symmetry (both A′), c-type Coriolis and Fermi interactions are expected to occur, even at low Ka transitions, which cannot be taken into consideration employing the actual RAM Hamiltonian. Consequently we prefer to exclude the v18 = 2 state from consideration and to provide the analysis of the ground and v18 = 1 states.
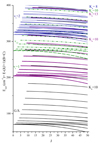 |
Fig. 3. Reduced energy diagram where the reduced energy of each rotational state of the different vibrational states is represented in function of the quantum number J. The reduced energies Ered are calculated as Ered(cm−1)=E − (J(J + 1)(B + C)) employing the energies obtained from the fit for the torsional states and the corrected ab initio values for v12. |
The complete dataset treated at the final stage of the current study contains 3055 a− and b−type transitions (where 474 are blended), including 1844 transitions of the ground state and 1211 transitions of the v18 = 1 state. The maximum values of Ka for the ground and v18 = 1 states are 18 and 12, respectively. All these rotational levels have a reduced energy lower than 400 cm−1, thus right below the energy of the V3 barrier. The final fit uses a model consisting of 38 parameters that reproduced the experimental data with a weighted root-mean-square deviation of 0.74. The list of parameters employed in the fit is presented in Table 1. Figure 2c compares an experimental spectrum to the predicted rotational spectrum as provided by our current theoretical model. As can be seen from Fig. 2c, the overall correspondence between experimental and theoretical spectra is very good. A slight inconsistency with intensity between predicted and observed spectra that may be visible for some strong lines is due to variations of source power and detector sensitivity.
The dataset of fitted transitions is presented in Table 2 where we provide quantum numbers for each level, followed by observed transition frequencies, experimental uncertainties and residuals from the fit. For the ground state together with the first and the second quanta of the torsional mode (v18 = 1), a list of their predicted transition frequencies up to 600 GHz (Jmax = 50), their associated uncertainty, strength (μ2S), Einstein coefficients (Aul), and their lower state energy (E″) is collected in Table 3. Since no rotational lines of v12 = 1 or J higher than 50 are included in the actual fit, higher discrepancies could be expected. The complete version of Tables 2 and 3 is available at the CDS, and only part of the tables is presented here for illustration purposes. The rotational and vibrational partition functions at different temperatures are tabulated in Table 4. The vibrational one is calculated as  (see Eq. (3.60) from Gordy & Cook 1984), where we considered the values of v18 = 1, v18 = 2 and v12 = 1. The rotational partition function is evaluated by summation over all ground-state levels predicted from the fit up to J = 50. From the values of Table 4, a significant contribution of the vibrational excited states to the partition function is expected at temperatures from ∼100 K.
Transitions included in the fit of vt = 0, 1 states.
Transitions of v18 = 0, 1 states predicted from the fit.
Rotational and vibrational partition function for methyl ketene at different temperatures.
Direct comparison of the results obtained in this study with the results of Bak et al. (1962, 1966) is not obvious owing to the two different methods used and significantly different datasets. As has been pointed out previously, in the present study, the transitions involving levels with low values of J and Ka quantum numbers from the studies of Bak et al. (1962, 1966) were refit to provide initial predictions. The results of this fit and several structural parameters related to the methyl torsion are presented in Table A.2. We also present in Table A.2 the same parameters issued from the global fit, and from ab initio calculations of the present study in order to provide a point of comparison. The rotational constants from ab initio calculations are given in the rho axis system for consistency. In general, the values obtained from this work are in agreement to those ab initio and those from the literature. We calculated the value of the methyl top moment of inertia Iα independently from F and from the ρ parameters (see equations in Table A.2 footnotes) to further check the consistency of the results of the global fit. In the rigid rotor approximation, the Iα values should be equal (Ilyushin 2011). Such an approximation is suitable for vibrational ground-state levels at low J and Ka quantum numbers, as it is the case of the assigned transitions in previous studies (Bak et al. 1962, 1966). However, considering higher energy levels, including the first torsional state requires that we account for the distortion of the methyl top due to the rotational and torsional motion. Such distortion may be partially taken into account by the independent variation of F and ρ. Consequently, Iα values calculated from F and from ρ may also differ in the case of a large dataset including excited torsional states. In the present study, the values of Iα(ρ) and Iα(F) are rather close with a relative error of about 1%, and they are within the range of typical values of moments of inertia for the methyl group, 3.1 uÅ2–3.3 uÅ2. Therefore we may claim that the obtained set of parameters presented in Table 1 properly describes the torsional-rotational problem for methyl ketene molecule. We also point out the improved accuracy of the main torsional-rotational parameters obtained in the present study, which also contributed to the accurate calculation of predicted spectra that were further used for radio astronomical observations.
5. Radio-astronomical observations
Thanks to the improved frequency predictions provided by the present work, we have carried out a rigorous search for methyl ketene in space. Although none of the C3H4O isomers have been unambiguously identified in space, the ubiquity of acetaldehyde (CH3CHO) in starless cores and star-forming regions (see, e.g., Ikeda et al. 2001; Kaifu et al. 2004; Cernicharo et al. 2012; Belloche et al. 2013) encourages us to search for methyl ketene (CH3CHCO) in those environments. We focused on the two most studied high-mass star-forming regions, Orion KL and Sagittarius (Sgr B2), on a starless core in Taurus Molecular Cloud (TMC-1), and on the cold dark cloud Barnard 1 (B1-b). We used the MADEX code (Cernicharo 2012) to exploit the spectroscopic parameters presented in this work and to derive the synthetic spectrum of this species (assuming local thermodynamic equilibrium) according to the physical parameters of the source (see below) collected in Table 5. The column density was the only free parameter for these models. Corrections for beam dilution were applied to each line depending on its frequency.
Physical parameters of the considered cloud cores.
Orion KL. Data from the Atacama Large Millimeter/submillimeter Array (ALMA) interferometer (Science Verification, SV) and the Institut de Radioastronomie Millimétrique (IRAM) 30 m telescope (Tercero et al. 2010, 2015) have been explored to search for CH3CHCO. The ALMA SV data allow us to obtain the spectrum between 213.7 and 246.7 GHz for different positions within the source characterized by different chemistry and physical parameters (see, e.g., Gong et al. 2015 and references therein). We distinguished (i) the hot core, a position in the middle of a clumpy structure where the emission peaks of ethylene glycol (HOCH2CH2OH, Brouillet et al. 2015), acetic acid (CH3COOH, Cernicharo et al. 2016; Favre et al. 2017), and methyl isocyanate (CH3NCO, Cernicharo et al. 2016) are located; (ii) the compact ridge, located at the emission peak of methyl formate (CH3OCOH, Favre et al. 2011), dimethyl ether (CH3OCH3, Brouillet et al. 2013), and ethyl methyl ether (CH3CH2OCH3, Tercero et al. 2015); and (iii) the MM4 source (see Wu et al. 2014), a clump that concentrates a large fraction of the emission of methyl isocyanate (Cernicharo et al. 2016) and acetone (CH3COCH3, Peng et al. 2013; Cernicharo et al. 2016) in the region. In addition, the IRAM 30 m data provide a very wide frequency band (80−307 GHz) of the average spectrum of the region inside the telescope beam. To model the CH3CHCO emission in these components, we have adopted physical parameters according to those derived by Cernicharo et al. (2016) and Tercero et al. (2015). Figure 4 shows selected frequencies and positions of these data together with the model derived by MADEX that demonstrates the lack of CH3CHCO lines above the confusion limit of these data.
 |
Fig. 4. Observed data of Orion KL and Sgr B2 taken with the IRAM 30-m telescope and the ALMA interferometer (histogram black spectrum) together with the synthetic spectra obtained using the column densities given as upper limits in Table 5 (red thin curve). The synthetic total model for the 30 m data of Sgr B2(N) (see Belloche et al. 2013) and Orion KL (see Cernicharo et al. 2016) is overlaid in green. A vLSR of +9.0 km s−1 and +64.0 km s−1 is assumed for Orion KL and Sgr B2, respectively. |
Sgr B2. We also searched for CH3CHCO in public data available for Sgr B2. We did not find this species above the detection limit of the data either in the PRIMOS survey1 (Neill et al. 2012) or in the IRAM 30 m data at 3 mm provided by Belloche et al. (2013). To estimate upper limits to the CH3CHCO column density in the region, we adopted the physical parameters derived by Belloche et al. (2013) for CH3CHO (see Table 5). Figure 4 shows the model provided by MADEX (red line) together with the IRAM 30 m data of Sgr B2(N). Interestingly, this model is consistent with the lack of methyl ketene lines above the detection limit of the PRIMOS data.
B1-b and TMC-1. Finally, we used the data presented in Cernicharo et al. (2012) to derive upper limits to the methyl ketene column density in dark clouds at different evolutionary stages (see Table 5).
Table 6 shows the CH3CHO/CH3CHCO column density ratios in Orion KL, Sgr B2, and B1-b. It is worth noting that the lower limit ratios derived agree for the considered Orion cores and for B1, and they are extremely low (∼2). For Sgr B2 we found also a moderate value, only ∼6 times larger than that derived for Orion. Although the dipole moment along the a-axis is similar for both species, the CH3CHCO partition function is ∼2 times larger (at 10–150 K) than that of CH3CHO. As a result, the CH3CHCO lines appear weaker than those of CH3CHO assuming similar abundances. Therefore, it is reasonable to suggest that the derived lower limit is far from the real abundance ratio between these species in the considered regions. Achieving higher sensitivity of the data with the current generation of telescopes is crucial to determine a more realistic value of the CH3CHO/CH3CHCO column density ratio.
Column density ratios.
6. Conclusion
Our theoretical calculation shows that methyl ketene (mk) is the C3H4O isomer with the closest energy to the most stable one, propenal (ap) (ΔEap − mk = 2.8 kJ mol−1 at CCSD(T)/aug-cc-pVTZ level of theory). Three transitions of the latter have been already detected towards Sgr B2 (Hollis et al. 2004). The closeness in energy of both isomers should make methyl ketene as good a candidate as anti-propenal for detection in the ISM. The millimeter-wave spectrum of this molecule has been analyzed in the 50–330 GHz frequency range in order to provide accurate rotational parameters that could allow its detection. The internal rotation of the CH3 group was analyzed employing the rho-axis method and the program RAM36 (Ilyushin et al. 2010). Notwithstanding the complexity of the analysis, more than 3000 transitions were assigned to the ground and first torsional state of methyl ketene. The height of the internal rotation barrier was found to be 429.37(11) cm−1 and the ρ value 0.194354(13). Both values are intermediate between acetic acid with lower values of ρ and V3 (Ilyushin et al. 2013) and acetaldehyde with higher ones (Smirnov et al. 2014). These parameters were employed to unsuccessfully search for its presence in star-forming regions at different evolutionary stages: Orion KL, Sgr B2, TMC-1, and B1-b. Higher sensitivity of the data is required to achieve a realistic abundance ratio between acetaldehyde and methyl ketene in the ISM.
The 100m Green Bank Telescope (GBT) PRebiotic Interstellar MOlecule Survey covers a frequency band between 7 and 50 GHz. Access to the entire PRIMOS data set, specifics on the observing strategy, and overall frequency coverage information is available at http://www.cv.nrao.edu/~aremijan/PRIMOS/.
Acknowledgments
The research leading to these results has received funding from the French Programme National “Physique et Chimie du Milieu Interstellaire”, and from the ANR-13-BS05-0008 IMOLABS of the French Agence Nationale de la Recherche. B.T. and J.C. thank funding support from Spanish MINECO (grants AYA2012-32032, AYA2016-75066-C2-1-P, and CSD2009-00038) and from the European Research Council (grant ERC-2013-SyG 610256, NANOCOSMOS). J.-C. G. thanks the Centre National d’Etudes Spatiales (CNES) for financial support.
References
- Bak, B., Christensen, D., Christiansen, J., Hansen-Nygaard, L., & Rastrup-Andersen, J. 1962, Spectrochim. Acta, 18, 1421 [NASA ADS] [CrossRef] [Google Scholar]
- Bak, B., Christensen, J. J., Kunstmann, K. A. J., Nygaard, L., & Rastrup-Andersen, J. 1966, J. Chem. Phys., 45, 883 [NASA ADS] [CrossRef] [Google Scholar]
- Belloche, A., Müller, H. S. P., Menten, K. M., Schilke, P., & Comito, C. 2013, A&A, 559, A47 [NASA ADS] [CrossRef] [EDP Sciences] [Google Scholar]
- Belloche, A., Meshcheryakov, A., & Garrod, R. 2017, A&A, 601, A49 [NASA ADS] [CrossRef] [EDP Sciences] [Google Scholar]
- Bottinelli, S., Ceccarelli, C., Williams, J. P., & Lefloch, B. 2007, A&A, 463, 601 [NASA ADS] [CrossRef] [EDP Sciences] [Google Scholar]
- Brouillet, N., Despois, D., & Baudry, A. 2013, A&A, 550, A46 [NASA ADS] [CrossRef] [EDP Sciences] [Google Scholar]
- Brouillet, N., Despois, D., & Lu, X. H. 2015, A&A, 576, A129 [NASA ADS] [CrossRef] [EDP Sciences] [Google Scholar]
- Cernicharo, J. 2012, in ECLA-2011: Proceedings of the European Conference on Laboratory Astrophysics, Laboratory Astrophysics and Astrochemistry in the Herschel/ALMA Era, 58, 251 [Google Scholar]
- Cernicharo, J., Marcelino, N., & Roueff, E. 2012, ApJ, 759, L43 [NASA ADS] [CrossRef] [Google Scholar]
- Cernicharo, J., Kisiel, Z., & Tercero, B. 2016, A&A, 587, L4 [NASA ADS] [CrossRef] [EDP Sciences] [Google Scholar]
- Daly, A. M., Bermudez, C., Kolesnikova, L., & Alonso, J. L. 2015, ApJS, 218, 30 [NASA ADS] [CrossRef] [MathSciNet] [Google Scholar]
- Endres, C. P., Schlemmer, S., Schilke, P., Stutzki, J., & Müller, H. S. 2016, J. Mol. Spectr., 327, 95 [NASA ADS] [CrossRef] [Google Scholar]
- Favre, C., Despois, D., & Brouillet, N. 2011, A&A, 532, A32 [NASA ADS] [CrossRef] [EDP Sciences] [Google Scholar]
- Favre, C., Pagani, L., & Goldsmith, P. F. 2017, A&A, 604, L2 [NASA ADS] [CrossRef] [EDP Sciences] [Google Scholar]
- Frisch, M. J., Trucks, G. W., & Schlegel, H. 2016, Gaussian09, Revision D. 01 (Wallingford, CT: Gaussian. Inc) [Google Scholar]
- Gong, Y., Henkel, C., & Thorwirth, S. 2015, A&A, 581, A48 [NASA ADS] [CrossRef] [EDP Sciences] [Google Scholar]
- Gordy, W., & Cook, R. 1984, Microwave Molecular Spectra (New York: Wiley) [Google Scholar]
- Herbst, E., & van Dishoeck, E. F. 2009, ARA&A, 47, 427 [NASA ADS] [CrossRef] [Google Scholar]
- Hollis, J. M., Jewell, P. R., Lovas, F. J., Remijan, A. J., & Mollendal, H. 2004, ApJ, 610, L21 [NASA ADS] [CrossRef] [Google Scholar]
- Hollis, J. M., Anthony, J. R., Jewell, P. R., & Lovas, F. J. 2006a, ApJ, 642, 933 [NASA ADS] [CrossRef] [Google Scholar]
- Hollis, J. M., Lovas, F. J., & Remijan, A. J. 2006b, ApJ, 643, L25 [Google Scholar]
- Ikeda, M., Ohishi, M., & Nummelin, A. 2001, ApJ, 560, 792 [NASA ADS] [CrossRef] [Google Scholar]
- Ilyushin, V., Kryvda, A., & Alekseev, E. 2009, J. Mol. Spectr., 255, 32 [NASA ADS] [CrossRef] [Google Scholar]
- Ilyushin, V. V. 2011, Radio Physics and Radio Astronomy, 16, 414 [Google Scholar]
- Ilyushin, V. V., Kisiel, Z., Pszczókowski, L., Mäder, H., & Hougen, J. T. 2010, J. Mol. Spectr., 259, 26 [NASA ADS] [CrossRef] [Google Scholar]
- Ilyushin, V. V., Endres, C. P., Lewen, F., Schlemmer, S., & Drouin, B. J. 2013, J. Mol. Spectr., 290, 31 [NASA ADS] [CrossRef] [Google Scholar]
- Jiménez-Serra, I., Vasyunin, A. I., & Caselli, P. 2016, ApJ, 830, L6 [Google Scholar]
- Jørgensen, J. K., van der Wiel, M. H. D., & Coutens, A. 2016, A&A, 595, A117 [NASA ADS] [CrossRef] [EDP Sciences] [Google Scholar]
- Kaifu, N., Ohishi, M., & Kawaguchi, K. 2004, PASJ, 56, 69 [NASA ADS] [CrossRef] [Google Scholar]
- Karton, A., & Talbi, D. 2014, Chem. Phys., 436–437, 22 [NASA ADS] [CrossRef] [Google Scholar]
- Kleiner, I. 2010, J. Mol. Spectr., 260, 1 [NASA ADS] [CrossRef] [Google Scholar]
- Lattelais, M., Pauzat, F., Ellinger, Y., & Ceccarelli, C. 2009, ApJ, 696, L133 [Google Scholar]
- Lattelais, M., Pauzat, F., Ellinger, Y., & Ceccarelli, C. 2010, A&A, 519, A30 [NASA ADS] [CrossRef] [EDP Sciences] [Google Scholar]
- Lattelais, M., Bertin, M., & Mokrane, H. 2011, A&A, 532, A12 [NASA ADS] [CrossRef] [EDP Sciences] [Google Scholar]
- McGuire, B. A., Burkhardt, A. M., & Kalenskii, S. 2018, Science, 359, 202 [NASA ADS] [CrossRef] [Google Scholar]
- Neill, J. L., Muckle, M. T., & Zaleski, D. P. 2012, ApJ, 755, 153 [NASA ADS] [CrossRef] [Google Scholar]
- Peng, T. C., Despois, D., & Brouillet, N. 2013, A&A, 554, A78 [NASA ADS] [CrossRef] [EDP Sciences] [Google Scholar]
- Quan, D., & Herbst, E. 2007, A&A, 474, 521 [NASA ADS] [CrossRef] [EDP Sciences] [Google Scholar]
- Remijan, A., Shiao, Y. S., Friedel, D. N., Meier, D. S., & Snyder, L. E. 2004, ApJ, 617, 384 [NASA ADS] [CrossRef] [Google Scholar]
- Requena-Torres, M. A., Martín-Pintado, J., & Rodríguez-Franco, A. 2006, A&A, 455, 971 [NASA ADS] [CrossRef] [EDP Sciences] [Google Scholar]
- Smirnov, I., Alekseev, E., Ilyushin, V., et al. 2014, J. Mol. Spectr., 295, 44 [NASA ADS] [CrossRef] [Google Scholar]
- Tercero, B., Cernicharo, J., Pardo, J. R., & Goicoechea, J. R. 2010, A&A, 517, A96 [NASA ADS] [CrossRef] [EDP Sciences] [Google Scholar]
- Tercero, B., Kleiner, I., & Cernicharo, J. 2013, ApJ, 770, L13 [Google Scholar]
- Tercero, B., Cernicharo, J., & López, A. 2015, A&A, 582, L1 [NASA ADS] [CrossRef] [EDP Sciences] [Google Scholar]
- Turner, B. E. 1977, ApJ, 213, L75 [NASA ADS] [CrossRef] [Google Scholar]
- Werner, H. J., Knowles, P. J., & Knizia, G. 2015, MOLPRO, version 2015.1, a package of ab initio programs [Google Scholar]
- Winther, F., Meyer, S., & Nicolaisen, F. M. 2002, J. Mol. Struct., 611, 9 [NASA ADS] [CrossRef] [Google Scholar]
- Wu, Y., Liu, T., & Qin, S. L. 2014, ApJ, 791, 123 [NASA ADS] [CrossRef] [Google Scholar]
- Xu, L.-H., Fisher, J., Lees, R., et al. 2008, J. Mol. Spectr., 251, 305 [NASA ADS] [CrossRef] [Google Scholar]
- Zakharenko, O., Motiyenko, R. A., Margulès, L., & Huet, T. 2015, J. Mol. Spectr., 317, 41 [Google Scholar]
Appendix A: Complementary tables
Ab initio calculations at MP2/aug-cc-pVTZ level of theory.
Rotational constants and internal rotation parameters in the ρ-axes-frame.
All Tables
Methyl ketene molecular parameters of ground state and torsional mode ν18 obtained from the fit using RAM36 program (A-reduction, ℐr-representation).
Rotational and vibrational partition function for methyl ketene at different temperatures.
All Figures
|
Fig. 1. Relative energy of C3H4O isomers calculated at CCSD(T)/aug-cc-pVTZ level of theory. |
| In the text | |
|
Fig. 2. Sections of the methyl ketene rotational spectrum. |
| In the text | |
|
Fig. 3. Reduced energy diagram where the reduced energy of each rotational state of the different vibrational states is represented in function of the quantum number J. The reduced energies Ered are calculated as Ered(cm−1)=E − (J(J + 1)(B + C)) employing the energies obtained from the fit for the torsional states and the corrected ab initio values for v12. |
| In the text | |
|
Fig. 4. Observed data of Orion KL and Sgr B2 taken with the IRAM 30-m telescope and the ALMA interferometer (histogram black spectrum) together with the synthetic spectra obtained using the column densities given as upper limits in Table 5 (red thin curve). The synthetic total model for the 30 m data of Sgr B2(N) (see Belloche et al. 2013) and Orion KL (see Cernicharo et al. 2016) is overlaid in green. A vLSR of +9.0 km s−1 and +64.0 km s−1 is assumed for Orion KL and Sgr B2, respectively. |
| In the text | |
Current usage metrics show cumulative count of Article Views (full-text article views including HTML views, PDF and ePub downloads, according to the available data) and Abstracts Views on Vision4Press platform.
Data correspond to usage on the plateform after 2015. The current usage metrics is available 48-96 hours after online publication and is updated daily on week days.
Initial download of the metrics may take a while.