Free Access
Fig. 3.
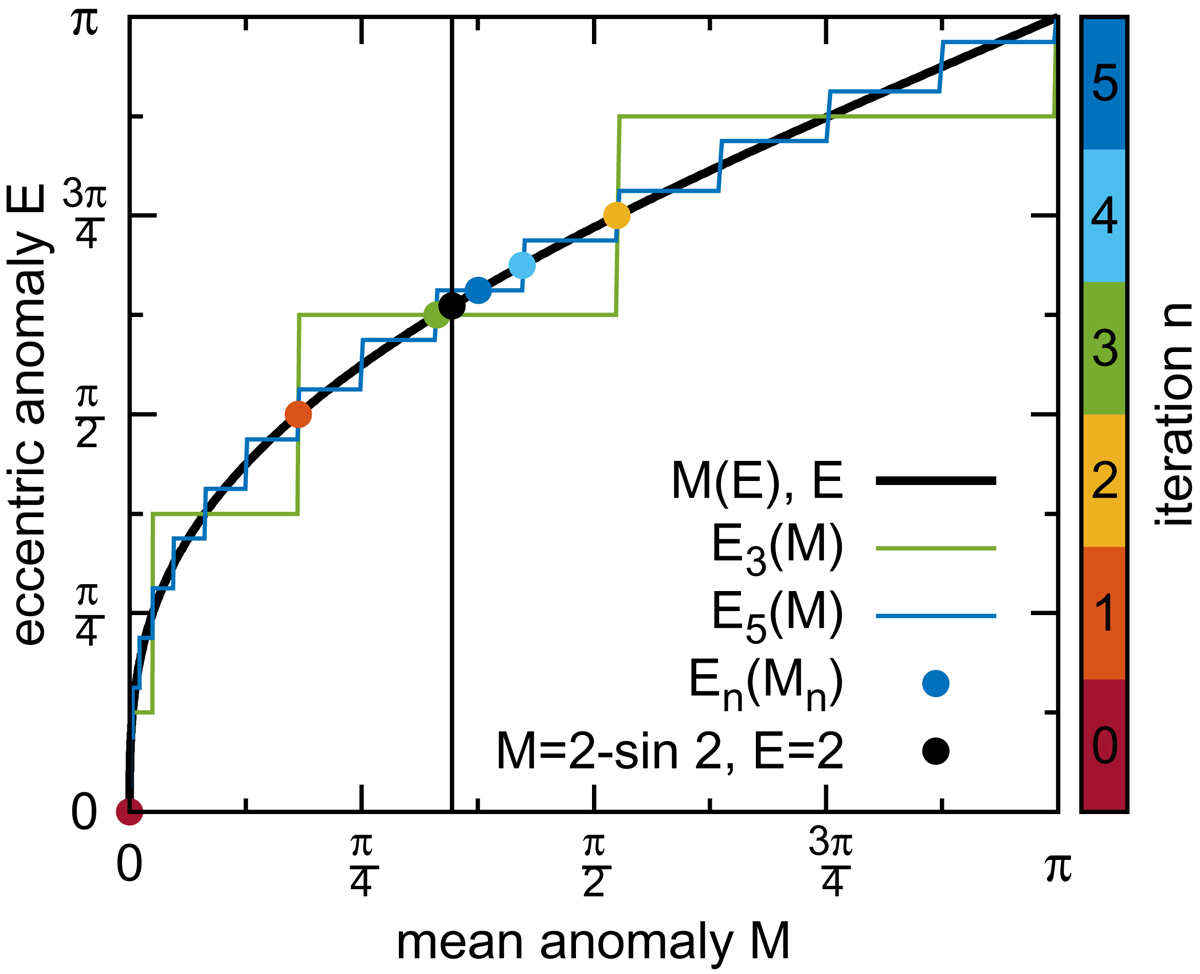
CORDIC-like approximation of Kepler’s equation (e = 1). The curves E3 and E5 illustrate the convergence towards Kepler’s equation after three and five iterations. The coloured points Mn, En are passed during the iterations to find E (M = 2 − sin2) (same colour-coding as in Fig. 2).
Current usage metrics show cumulative count of Article Views (full-text article views including HTML views, PDF and ePub downloads, according to the available data) and Abstracts Views on Vision4Press platform.
Data correspond to usage on the plateform after 2015. The current usage metrics is available 48-96 hours after online publication and is updated daily on week days.
Initial download of the metrics may take a while.