Fig. 9.
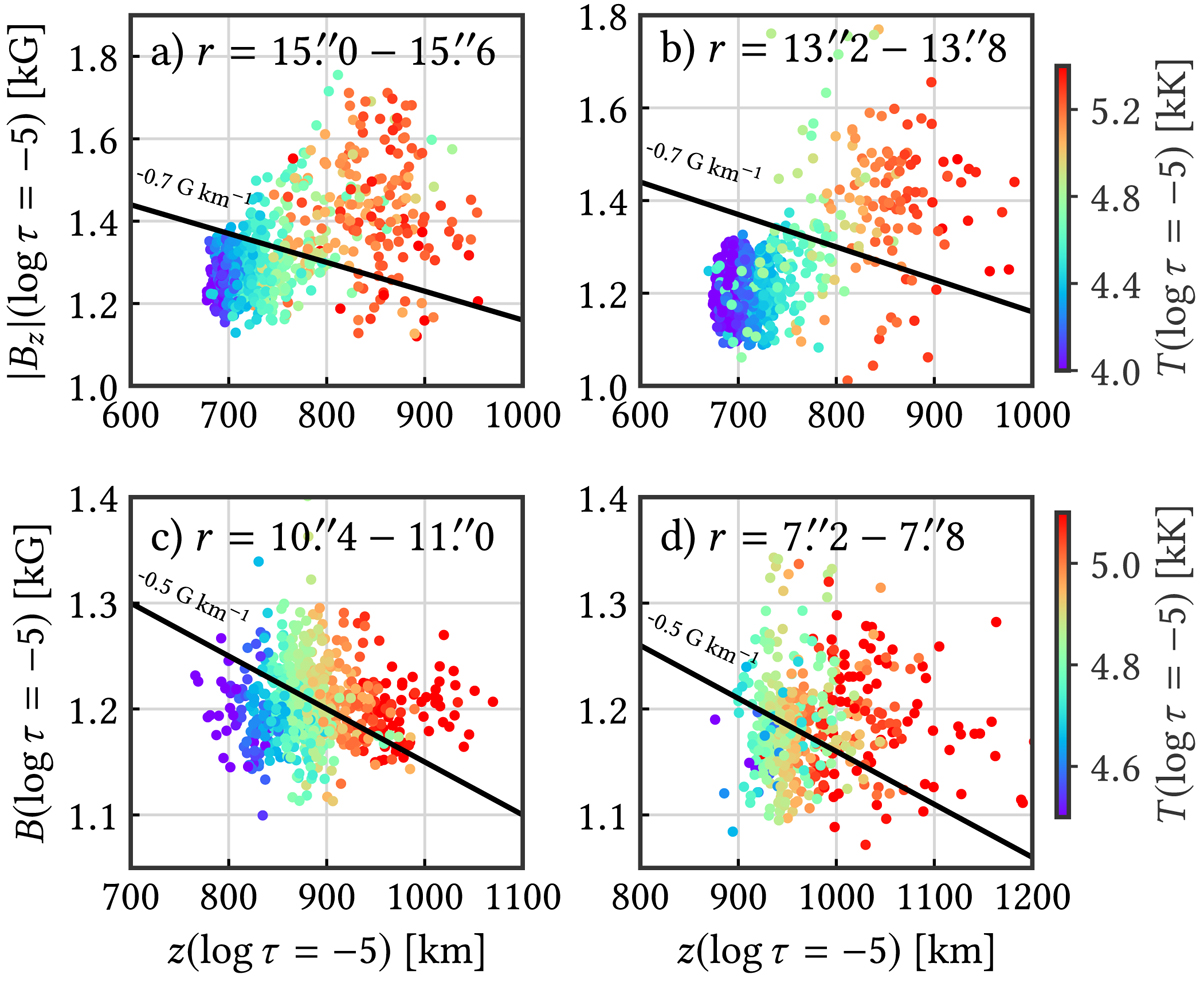
Distribution of |Bz| as a function of z(log τ = −5) for the time-series of two locations in the umbra (top) and two locations in the penumbra (bottom). Panel a: relation |Bz| and z in the umbra at r = 15″.0–15″.6. Panel b: similar to panel a but for r = 13″.2–13″.8. Panels c and d are taken at r = 10″.4–11″.0 and r = 7″.2–7″.8, respectively. The black lines show the average vertical gradient of |Bz| in the umbra (–0.7 G km−1) and penumbra (–0.5 G km−1). The points have been color-coded according to their temperature T (log τ = −5).
Current usage metrics show cumulative count of Article Views (full-text article views including HTML views, PDF and ePub downloads, according to the available data) and Abstracts Views on Vision4Press platform.
Data correspond to usage on the plateform after 2015. The current usage metrics is available 48-96 hours after online publication and is updated daily on week days.
Initial download of the metrics may take a while.