Fig. 7.
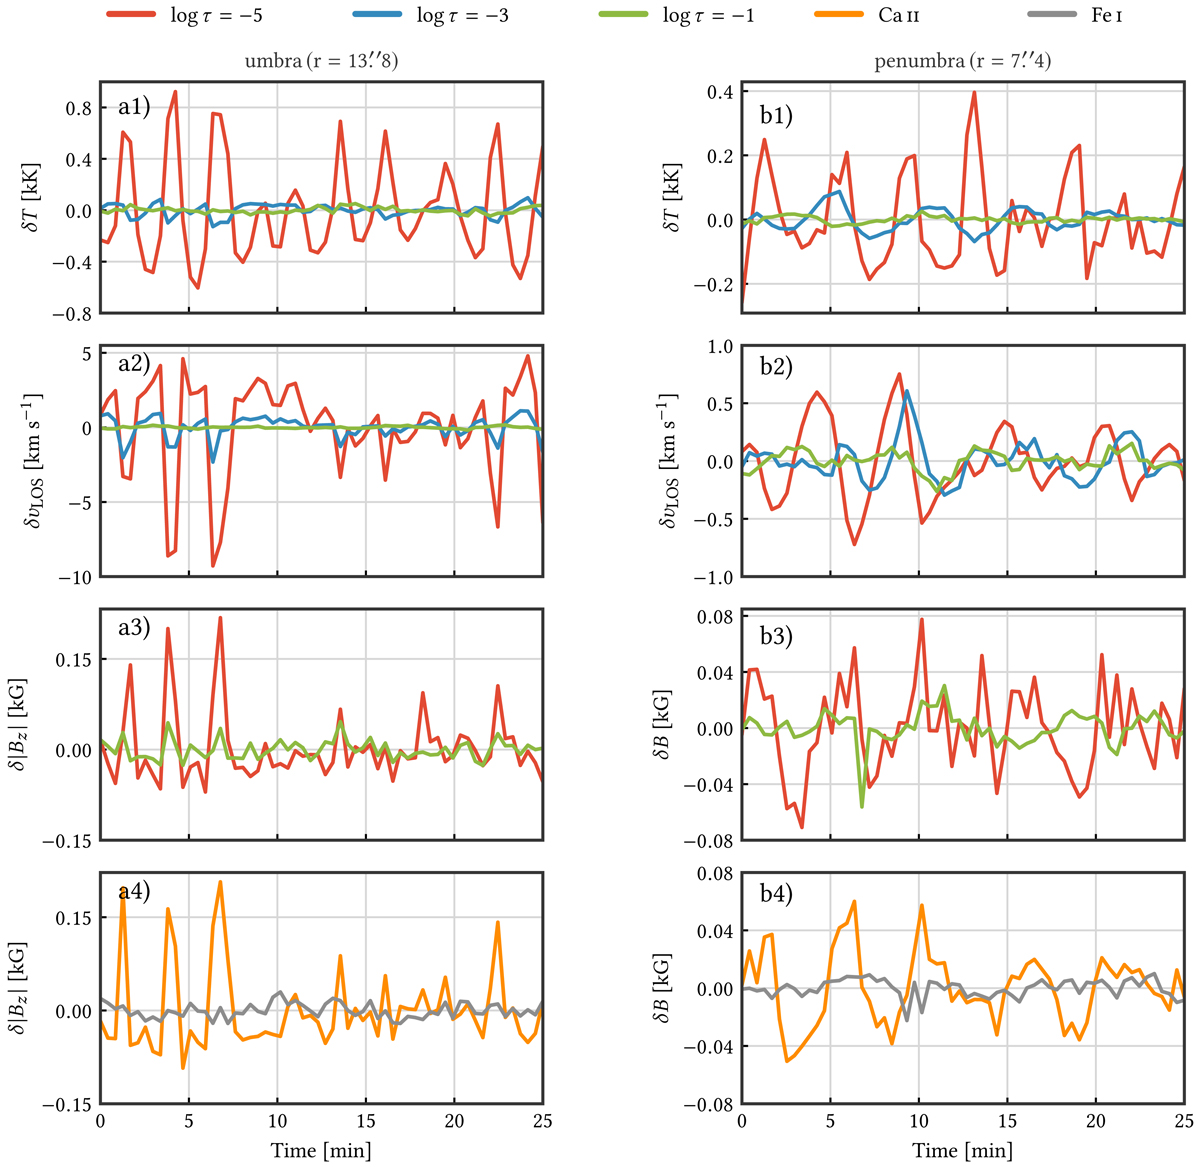
Temporal variations of the atmospheric parameters in the umbra (left column), and penumbra (right column) after removing the local background. The curves plotted in these panels correspond to r = 13″.8 and r = 7″.4 for the umbral and penumbral sets, respectively. From top to bottom,(panels a1–a3): δT, δυLOS and, δ|Bz| from the inversions of the Ca II 8542 Å line including a linear gradients in the magnetic field as a function of log τ. Panel a4: δ|Bz| from the inversions of the Ca II 8542 Å line (orange curve) and the Fe I line pair at 6302 Å (gray curve) separately with the assumption that the magnetic field is depth independent. Panels b1–b4 are similar to panels a1–a4, but the former depict δB instead of δ|Bz|. The red, blue, and green curves correspond to log τ = −5, −3, and, −1.
Current usage metrics show cumulative count of Article Views (full-text article views including HTML views, PDF and ePub downloads, according to the available data) and Abstracts Views on Vision4Press platform.
Data correspond to usage on the plateform after 2015. The current usage metrics is available 48-96 hours after online publication and is updated daily on week days.
Initial download of the metrics may take a while.