Fig. 4.
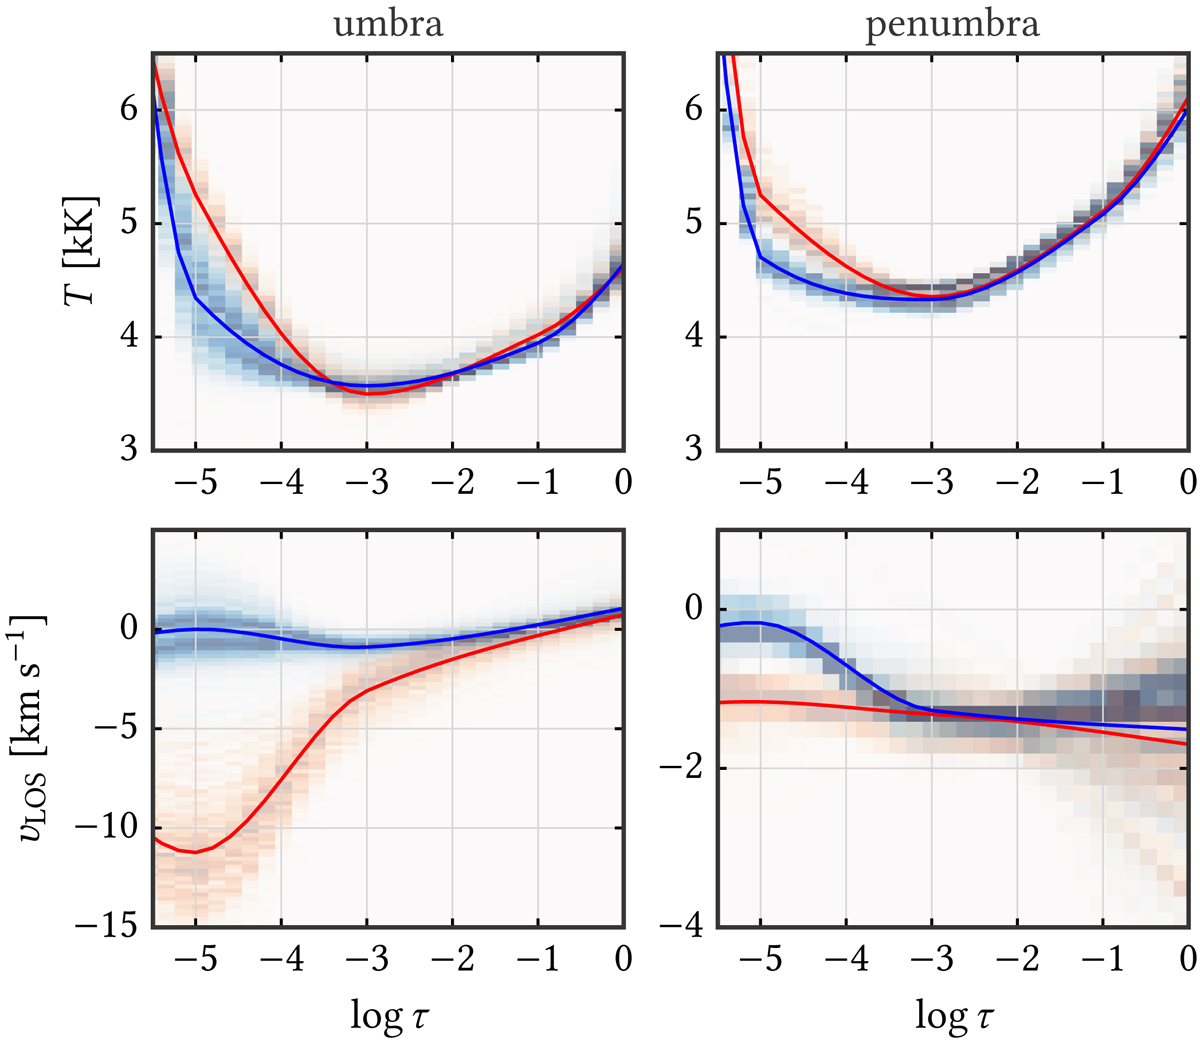
Averaged stratification of T and υLOS as a function of optical depth obtained from the inversions of the Ca II 8542 Å line. Upper-left and lower-left panels: stratification of T and υLOS in the umbra, respectively. The red and blue curves represent the umbral flash and quiescent umbra atmosphere, respectively. Panels on the right: stratification of the same physical parameters in the penumbra. The shaded areas in all panels demonstrate the distribution of the parameters normalized at each log τ position.
Current usage metrics show cumulative count of Article Views (full-text article views including HTML views, PDF and ePub downloads, according to the available data) and Abstracts Views on Vision4Press platform.
Data correspond to usage on the plateform after 2015. The current usage metrics is available 48-96 hours after online publication and is updated daily on week days.
Initial download of the metrics may take a while.