Fig. 2.
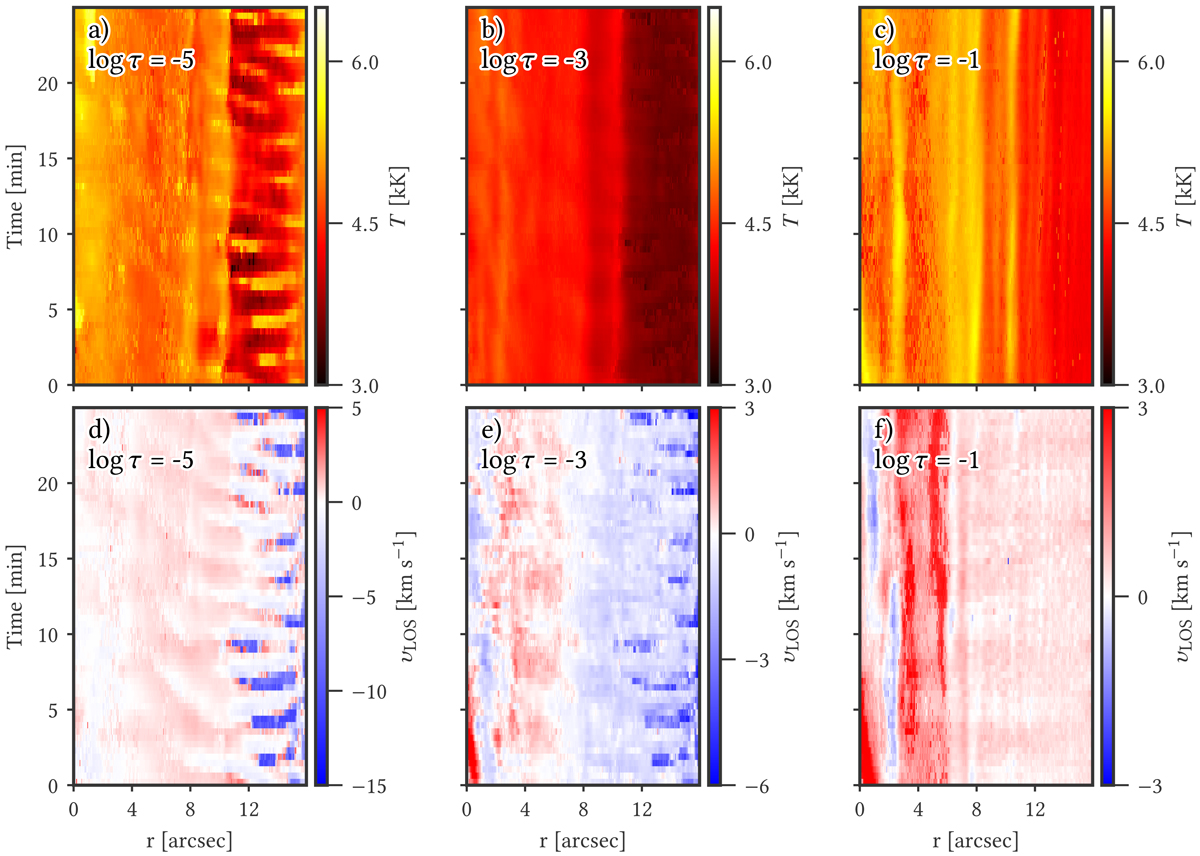
Temporal evolution of the temperature (top panels) and line-of-sight velocity (bottom panels) at log τ = −5, −3, and, −1. Panels a, b, d, and e illustrate the results from our inversions of the Ca II 8542 Å line, whereas panels c and f are taken from the inversion of the Fe I 6301.5 and 6302.5 Å lines. r = 0 corresponds to the outer-most point from the sunspot in the red cut marked in Fig. 1.
Current usage metrics show cumulative count of Article Views (full-text article views including HTML views, PDF and ePub downloads, according to the available data) and Abstracts Views on Vision4Press platform.
Data correspond to usage on the plateform after 2015. The current usage metrics is available 48-96 hours after online publication and is updated daily on week days.
Initial download of the metrics may take a while.