Fig. 4.
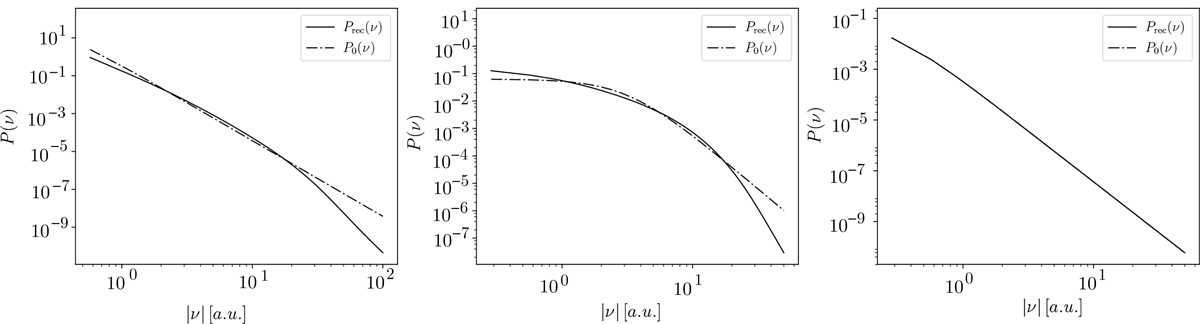
Reconstructed power spectrum of s in its spatial (panel a) and spectral sub-domain (panel b) and u in its spectral domain (panel c). The dashed black line indicates the default spectrum from which the Gaussian random fields, shown in Fig. 3, were drawn, while the solid black lines show its reconstruction. In case of ![]() , both lines are in such close agreement that they are visually indistinguishable.
, both lines are in such close agreement that they are visually indistinguishable.
Current usage metrics show cumulative count of Article Views (full-text article views including HTML views, PDF and ePub downloads, according to the available data) and Abstracts Views on Vision4Press platform.
Data correspond to usage on the plateform after 2015. The current usage metrics is available 48-96 hours after online publication and is updated daily on week days.
Initial download of the metrics may take a while.