Fig. 2.
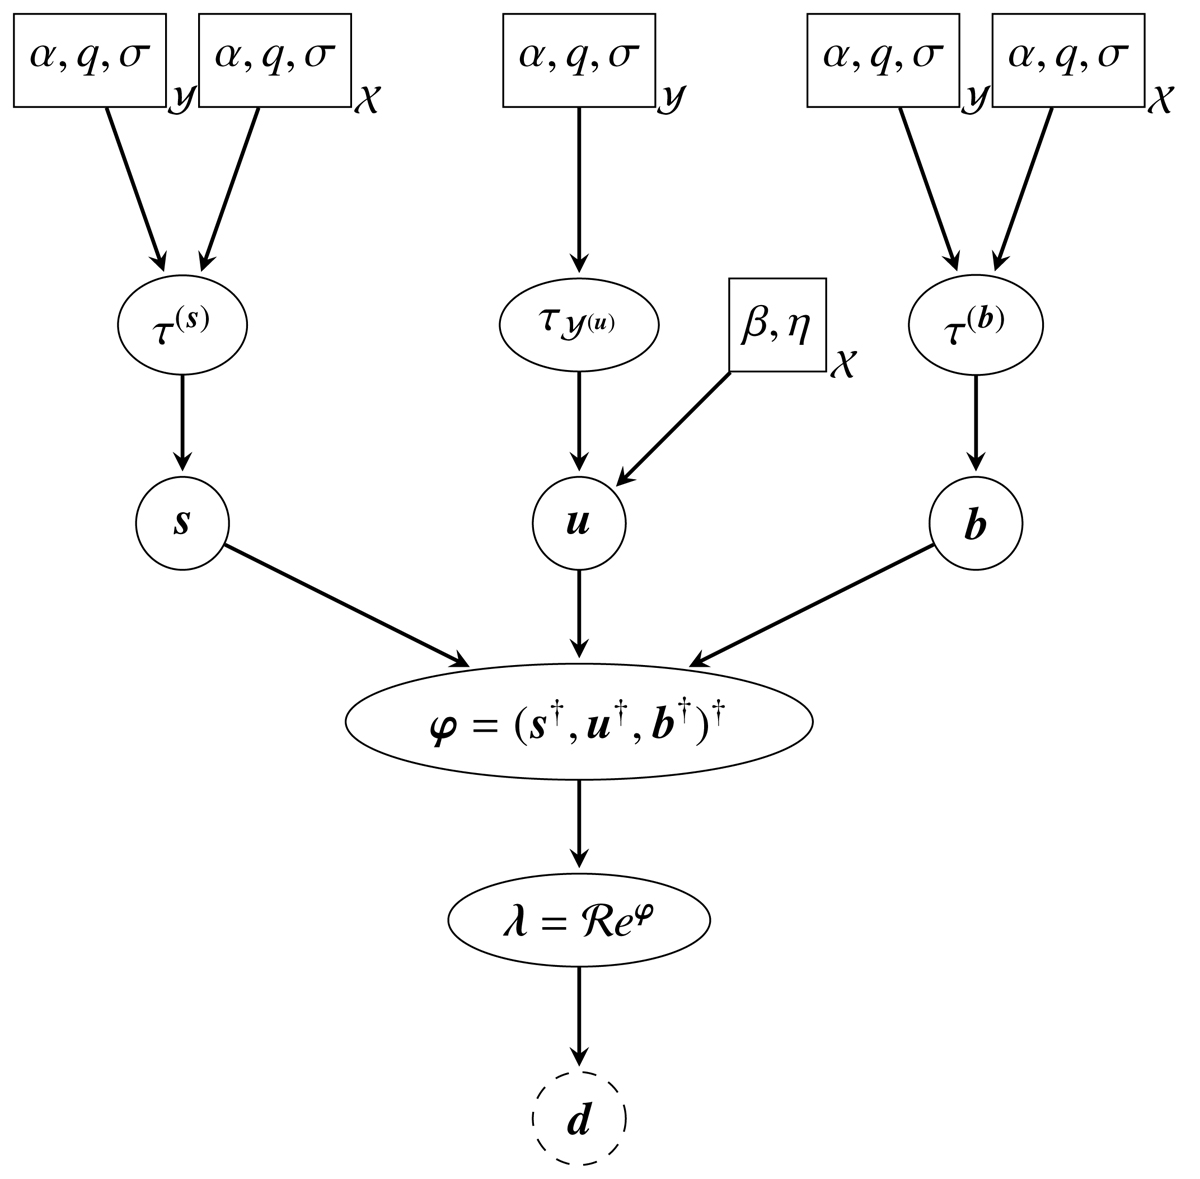
Graphical model of the hierarchical Bayesian network introduced in Sect. 2. Shown are the model parameters α, q, σ, η and β, in rectangular boxes, as they have to be specified by the user. The logarithmic spectral parameters ![]() and
and ![]() the diffuse signal field φ, and the expected number of photons λ, are inferred by the algorithm and shown in black solid circles. The observed photon count data, d, is marked by a dashed circle at the bottom.
the diffuse signal field φ, and the expected number of photons λ, are inferred by the algorithm and shown in black solid circles. The observed photon count data, d, is marked by a dashed circle at the bottom.
Current usage metrics show cumulative count of Article Views (full-text article views including HTML views, PDF and ePub downloads, according to the available data) and Abstracts Views on Vision4Press platform.
Data correspond to usage on the plateform after 2015. The current usage metrics is available 48-96 hours after online publication and is updated daily on week days.
Initial download of the metrics may take a while.