| Issue |
A&A
Volume 619, November 2018
|
|
|---|---|---|
| Article Number | A28 | |
| Number of page(s) | 11 | |
| Section | Interstellar and circumstellar matter | |
| DOI | https://doi.org/10.1051/0004-6361/201731980 | |
| Published online | 30 October 2018 | |
The ALMA-PILS survey: Stringent limits on small amines and nitrogen-oxides towards IRAS 16293–2422B
1
Raymond and Beverly Sackler Laboratory for Astrophysics, Leiden Observatory, Leiden University,
PO Box 9513,
2300
RA Leiden,
The Netherlands
2
Leiden Observatory, Leiden University,
PO Box 9513,
2300
RA Leiden,
The Netherlands
e-mail: This email address is being protected from spambots. You need JavaScript enabled to view it.
3
Centre for Star and Planet Formation, Niels Bohr Institute & Natural History Museum of Denmark, University of Copenhagen,
Øster Voldgade 5–7,
1350
Copenhagen,
Denmark
4
Laboratoire d’Astrophysique de Bordeaux, Université de Bordeaux, CNRS, B18N, allée Geoffroy Saint-Hilaire,
33615
Pessac,
France
5
SKA Organization, Jodrell Bank Observatory, Lower Withington, Macclesfield,
Cheshire
SK11 9DL,
UK
6
Center for Space and Habitability (CSH), University of Bern,
Sidlerstrasse 5,
3012
Bern,
Switzerland
7
I. Physikalisches Institut, Universität zu Köln,
Zülpicher Str. 77,
50937
Köln,
Germany
8
ASTRON, The Netherlands Institute for Radio Astronomy,
Postbus 2,
7990 AA
Dwingeloo,
The Netherlands
9
Max-Planck Institut für Extraterrestrische Physik (MPE),
Giessenbachstr. 1,
85748
Garching,
Germany
Received:
22
September
2017
Accepted:
31
July
2018
Abstract
Context. Hydroxylamine (NH2OH) and methylamine (CH3NH2) have both been suggested as precursors to the formation of amino acids and are therefore, of interest to prebiotic chemistry. Their presence in interstellar space and formation mechanisms, however, are not well established.
Aims. We aim to detect both amines and their potential precursor molecules NO, N2O, and CH2NH towards the low-mass protostellar binary IRAS 16293–2422, in order to investigate their presence and constrain their interstellar formation mechanisms around a young Sun-like protostar.
Methods. ALMA observations from the unbiased, high-angular resolution and sensitivity Protostellar Interferometric Line Survey (PILS) are used. Spectral transitions of the molecules under investigation are searched for with the CASSIS line analysis software.
Results. CH2NH and N2O are detected for the first time, towards a low-mass source, the latter molecule through confirmation with the single-dish TIMASSS survey. NO is also detected. CH3NH2 and NH2OH are not detected and stringent upper limit column densities are determined.
Conclusions. The non-detection of CH3NH2 and NH2OH limits the importance of formation routes to amino acids involving these species. The detection of CH2NH makes amino acid formation routes starting from this molecule plausible. The low abundances of CH2NH and CH3NH2 compared to Sgr B2 indicate that different physical conditions influence their formation in low- and high-mass sources.
Key words: astrochemistry / stars: formation / stars: protostars / ISM: molecules / ISM: individual objects: IRAS 16293–2422 / astrobiology
© ESO 2018
1 Introduction
The small molecules methylamine (CH3NH2) and hydroxylamine (NH2OH) with an amine (−NH2) functional group have both been suggested as precursors to the formation of amino acids (Blagojevic et al. 2003; Holtom et al. 2005; Snow et al. 2007; Bossa et al. 2009; Barrientos et al. 2012; Garrod 2013). Reactions involving these molecules could explain the presence of simplest amino acid glycine in comets (Elsila et al. 2009; Altwegg et al. 2016). Despite their importance, both CH3NH2 and NH2OH have turned out to be quite elusive molecules in the interstellar medium. CH3NH2 has exclusively been detected towards Sgr B2 and tentatively to Orion KL (e.g., Kaifu et al. 1974; Pagani et al. 2017). Upper limit abundances of CH3NH2 towards other high-mass sources are generally found to be consistent with values determined towards Sgr B2 (Ligterink et al. 2015). In the solar system, CH3NH2 has been detected in comets 81P/Wild 2 and 67P/Churyumov–Gerasimenko (hereafter 67P/C–G; Elsila et al. 2009; Goesmann et al. 2015; Altwegg et al. 2017). NH2OH has not been detected thus far, down to upper limit abundances of ~10−11 with respectto H2 (Pulliam et al. 2012; McGuire et al. 2015).
The lack of detection of these two molecules not only constrains amino acid formation, but also contrasts with model predictions. Garrod et al. (2008) predicted efficient CH3NH2 formation from the radical addition reaction CH3 + NH2 in their models, whereas NH2OH is assumed to form from the NH + OH addition followed by hydrogenation and NH2 + OH reactions on ice surfaces. Abundances of CH3NH2 and NH2OH are predicted to be on the order of 10−6 –10−7, depending on the model. It is generally found that these models overproduce both molecules compared with observations (Pulliam et al. 2012; Ligterink et al. 2015). Therefore, other formation, reaction or destruction mechanisms need to be considered.
Several laboratory experiments have investigated the formation of NH2OH and CH3NH2. Zheng & Kaiser (2010) show the formation of NH2OH from electron irradiated H2O:NH3 ice mixtures, while He et al. (2015) produce the molecule by oxidation of NH3 ice. Alternatively, NH2OH is seen to efficiently form from the solid-state hydrogenation of nitric oxide (NO; Congiu et al. 2012; Fedoseev et al. 2012). In this scenario, NO is accreted from the gas-phase onto dust grains during cloud collapse (Visser et al. 2011). Nitrous oxide (N2O) is found as a by-product of NO hydrogenation reactions. NO has been observed in a variety of sources (e.g., Liszt & Turner 1978; Yıldız et al. 2013; Codella et al. 2018). It is thought to mainly form via the N + OH → NO + H neutral–neutral reaction in the gas-phase. Observations suggest that N2O is related to NO (Ziurys et al. 1994; Halfen et al. 2001).
CH3NH2 formation has been demonstrated in electron irradiated CH4:NH3 ice mixtures (Kim & Kaiser 2011; Förstel et al. 2017), with the main formation pathways suggested to proceed through CH3 + NH2 radical reactions. Theule et al. (2011) investigated hydrogenation of solid hydrogen cyanide (HCN) and methanimine (CH2 NH), both of which lead to CH3NH2 formation. CH2NH is hypothesized to have a larger reaction probability than HCN and reaction-pathways to CH3NH2 may be completely different for reactions starting from either HCN or CH2 NH. In contrast with CH3NH2, its potential precursor CH2NH has been observed in numerous sources (Dickens et al. 1997; Nummelin et al. 2000; Belloche et al. 2013; Suzuki et al. 2016). Halfen et al. (2013) investigated the relationship between this molecule and CH3NH2 in Sgr B2 and concluded that the two species have different formation routes, due to observed differences in rotational temperature and distribution. Interestingly, CH2NH has also been implied as a precursor to amino acid formation (e.g., Woon 2002; Danger et al. 2011).
Searches for CH3NH2 and NH2OH have so far mainly focused on high-mass sources. Detections or upper limits of these two molecules and their potential precursors towards a low-mass source would therefore, expand our understanding of amine-containing molecules and their formation in the ISM. The low-mass solar-type protostellar binary IRAS 16293–2422 (hereafter IRAS 16293) is an ideal source for such a study. Its physics and chemistry are well studied and it is abundant in complex organic molecules (e.g., Jørgensen et al. 2016). Abundance ratios will therefore, constrain the chemistry of −NH2 molecules ashas been done for other nitrogen-bearing species (Coutens et al. 2016; Ligterink et al. 2017). In this paper, we present the first detection of CH2NH and N2O towards a low-mass protostar. NO is also detected and analysed. The abundances of NH2OH and CH3NH2 are constrained by upper limits from non-detections.
2 Observations and data analysis
The observations were taken as part of the Protostellar Interferometric Line Survey (PILS), an unbiased-spectral survey using the Atacama Large Millimeter Array (ALMA; Jørgensen et al. 2016). The survey covers a spectral range of 329.147–362.896 GHz in Band 7, obtained with the 12 m array and the Atacama Compact Array (ACA). The combined data set analysed in this work was produced with a circular restoring beam of 0.′′ 5. The maximum recoverable scale is 13′′. A spectral resolution of0.2 km s−1 and a root mean square (RMS) noise level of about 7–10 mJy beam−1 channel−1, i.e., approximately 4–5 mJy beam−1 km s−1 is obtained. The dataset has a calibration uncertainty of 5–10%.
The spectral analysis presented below is performed towards source B in IRAS 16293 at a position offset by one beam diameter (0.′′ 5) from the continuum peak position in the south-west direction (αJ2000 = 16h 32m22. s58, δJ2000 = −24°28′32.8′′). This position is used for most other PILS molecular identifications and abundance analyses (Coutens et al. 2016; Lykke et al. 2017; Persson et al. 2018). Lines are particularly narrow towards this position, only 1 km s−1, limiting line confusion.
The spectra are analysed with the CASSIS software1 and linelists from the Jet Propulsion Laboratory (JPL2) catalog for molecular spectroscopy (Pickett et al. 1998) and Cologne Database for Molecular Spectroscopy (CDMS; Müller et al. 2001, 2005). Specifically rotational spectroscopic data of NO, N2O, CH2NH, NH2OH, and CH3NH2 are used (Kirchhoff et al. 1973; Pickett et al. 1979; Morino et al. 2000; Ilyushin et al. 2005; Ting et al. 2014). Identified transitions are fitted with synthetic spectra, assuming Local Thermodynamic Equilibrium (LTE). The input for these fits is given by the column density (N), excitation temperature (Tex), line width (FWHM = 1 km s−1), peak velocity (Vpeak), and a source size of 0.′′5, based on the observed spatial extent of the emission. CASSIS software takes beam dilution into account by  /(
/( ).
).
Warm, dense dust is present around IRAS 16293B and its emission is coupled to the molecular line emission. This affects the line strength of molecular emission and needs to be corrected by taking a higher background temperature into account, see Eq. (1) for the line brightness TB(ν).
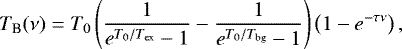 (1)
(1)
where T0 = hν/kB, with h being the Planck constant and kB the Boltzmann constant. For the one beam offset position at source B Tbg = 21 K, compared to the usual cosmic microwave background temperature of Tbg = 2.7 K.
To compute the best-fit spectral models for each molecule, a grid of models is run to determine the best fitting synthetic spectra. For CH2NH, N was varied between 1 × 10¹⁴ and 5 × 1015 cm−2 and Tex between 25 and 300 K, while for NO and N2O the parameter space of N = 1 × 10¹⁵–1 × 1017 cm−2 and Tex = 25–400 K was explored. The Vpeak parameter space is explored between 2.5 and 2.9 km s−1 and the line FWHM is fixed to 1 km s−1, as found for most transitions at this position in the PILS data set (Jørgensen et al. 2016). From this model grid, we obtain the best-fit model solutions through χ2 minimisation. Generally, we accept fits that are within the observational uncertainty of the observed line profile as judged by eye.
The uncertainty in the data, derives from the calibration error (10%) and the RMS noise (mJy beam−1 channel−1) as  , with Tpeak the peak brightness of a line. This uncertainty also applies to any best-fit synthetic model. In Table A.1, model parameters for each detected transition, as well as their errors are given. The error on the peak velocity equals the channel width of the observations. The FWHM is kept as a fixed parameter. The error on the peak brightness temperature (Tpeak) is determined from the combination of the RMS and the calibration error of the data, as mentioned above. The largest source of error on the column density and excitation temperature comes from the quality of the fit of spectral model to the data, particularly due to the large number of blended lines in the PILS dataset. The best-fit model results are listed in Table 1.
For the non-detected species the formalism in Ligterink et al. (2015) is used to derive upper limit column densities based on the 3σ upper limit line intensities of the strongest transitions in line-free ranges of the PILS data. The 1σ limit is given by 1.1 RMS, where the factor 1.1 accounts for a 10% calibration uncertainty, δν the velocity resolution of the data (0.2 km s−1), FWHM is the line width at the one beam offset position in source B (1 km s−1) and RMS the noise in mJy beam−1 bin−1.
3 Results
Spectral lines from CH2NH, NO, and N2O emission are detected, while those of CH3NH2 and NH2OH are not. An overviewof the detected transitions is presented in Table A.1. Figures 1–3 show the detected transitions of CH2NH, NO, and N2O towards source B, with synthetic spectra overplotted.
CH2NH is detected for the first time towards a low-mass protostellar source. A total of 18 hyperfine transitions in four different spectral features are detected. The first feature shows up at 332.575 GHz and is blended with a neighbouring methylformate (CH3OCHO) line. At 340.354 GHz five hyperfine lines form a distinct feature that is unblended with any other molecule. Around 351.455 GHz a distinct double peak feature is found and at 360.294 GHz the fourth feature is seen. These last three features are found to be unblended. ALMA observations in bands 3, 4, 6, and 9 towards IRAS 16293 were used to search for additional lines, but spectral features of CH2NH fall outside the spectral windows of these observations. Publicly available data of the single dish TIMASSS survey towards IRAS 16293 (Caux et al. 2011) were analysed for CH2NH spectral features, but no lines were detected, suggesting that the emission indeed arises mostly from a compact source.
Upper state energies (Eup) of the detected features range from 26 to 183 K, making it possible to constrain the excitation temperature. Using a grid of models, the emissionof this species can be fitted with excitation temperatures ranging between 70 and 120 K and column densities of 6.0 × 10¹⁴–10.0 × 1014 cm−2. Outside thistemperature range synthetic spectra cannot reproduce the observed spectrum, as can be seen in Fig. B.1 for fits at Tex = 50 and 150 K. The peak velocity is found to be 2.7 km s−1. For the best fits, no anti-coincidence is found between the synthetic and observed spectrum. Figure 1 shows the synthetic spectrum at Tex = 100 K and N = 8.0 × 1014 cm−2.
Five NO transitions, each with an upper state energy of 36 K, are detected. A number of NO lines at Eup = 209 K are in the spectral range covered by the data, but are not detected. The excitation temperaturecan therefore be constrained to be lower than 150 K, otherwise anti-coincidences with the Eup = 209 K lines in the synthetic spectrum show up, as can be seen in Fig. B.2. The emission can be fitted with Tex = 40–150 K and N = 1.5 × 10¹⁶–2.5 × 1016 cm−2. A peak velocity of Vpeak = 2.5 km s−1 is found for the NO lines, slightly offset from the VLSR = 2.7 km s−1 of source B. A similar offset is seen for other species in the PILS dataset, specifically acetaldehyde and ethylene oxide (Lykke et al. 2017; Jørgensen et al. 2018). Note that seven NO lines have already been detected towards the same source in the TIMASSS survey by Caux et al. (2011). These lines do not arise from the same regions. The lines from the TIMASSS survey are emitted in the cold envelope and source A, since they show a VLSR of ~4.0 km s−1 (Caux et al. 2011), while the lines in the PILS data come from the hot core region in source B. Figure 2 shows the synthetic model to the observational data at an excitation temperature of 100 K and column density of 2.0 × 1016 cm−2.
Three N2O transitions fall in the frequency range of the PILS data, one v = 0 line with Eup = 127 K and two v2 = 1 lines with Eup = 973 K. In the observed spectrum a feature is found that fits the v = 0 line at 351.667 GHz. Since no other known species were found to correspond to this feature, a tentative detection of N2O can be claimed. Similar to NO, Vpeak = 2.5 km s−1 fits the position of this line. Based on the non-detection of the v2 = 1 lines, the excitation temperature can be constrained to be lower than 350 K.
To further support this assignment, additional datasets were checked. No N2O lines were covered in ALMA Band 3, 4, 6, and 9 datasets towards IRAS 16293. However, analysis of data from the TIMASSS survey resulted in the identification of a number of features. Four N2O lines are found to be unblended (see Fig. C.1). Based on Gaussian fitting of the profiles, the peak velocity of the four lines is 2.5 km s−1, similar to the N2O transition detected towards source B in the PILS survey. However, velocity components at 3.9 km s−1, resulting from source A or extended emission, cannot be entirely ruled out. Based on a comparison of the N2O 351.667 GHz line flux of 394 mJy beam−1 km s−1 or 15.7 K km s−1 in the ALMA-PILS and 0.2 K km s−1 in the JCMT-TIMASSS data, the emitting area in the TIMASSS data is found to be around 1.′′ 6. This is supported by the integrated emission map of the N2O 351.667 GHz line (Fig. 4), where the emission has a larger FWHM than other species. The best fit to the optically thin lines in the TIMASSS data is found for Tex = 68 K and N = 1.7 × 1016 cm−2 (see Fig. C.2). Note that the precise source size for N2O can change the excitation temperature by a couple tens of Kelvin, but can be constrained to be below 100 K, and column density by ±25%. See Appendix C for further details.
In the PILS data, at Tex = 100 K a column density of 5.0 × 1016 cm−2 is derived for the N2O 351.667 GHz transition, see Fig. 3. However, since the TIMASSS data indicate that the excitation temperature is likely lower than 100 K, this line was fitted with Tex = 25–100 K. For these temperatures, emission is found to be optically thick and the column density is constrained to be ≥ 5.0 × 1016 cm−2 for the entire temperature range. Excitation temperatures between 100 and 350 K cannot be neglected and for this range column densities of ≥ 4.0 × 1016 cm−2 are derived.
Finally, lines of the 15N and 18O isotopologues of N2O were searched for in the PILS data, but not detected to levels above the standard 14N/15N and 16O/18O ISM ratios (see Wilson 1999; Milam et al. 2005). Both the 15N14NO and 14N15NO transition are blended with an unknown feature and a HN13CO line, respectively. For N O an upper limit column density of ≤ 1 × 1015 cm−2 at Tex = 100 K is determined, resulting in N2O/N
 O > 40 compared to an expected 18O/16O ratio of 560 (Wilson 1999).
Figure 4 shows the emission maps of the 332.572 GHz line of CH2NH, the 351.052 GHz line of NO, and the 351.668 GHz line of N2O towards source B. Emission is generally found to be compact and compares well with emission maps of other molecules towards source B, such as NH2CHO (Coutens et al. 2016). Emission of N2O is more extended than that of NO.
Transitions of both CH3NH2 and NH2OH are not detected and therefore upper limit column densities are determined. For CH3NH2, the 61 → 50 transition at 357.440 GHz best constrains the upper limit column density. For a 3σ upper limit line intensity of 23 mJy km s−1, the upper limit column densities versus the rotational temperatures are plotted in Fig. D.1. At Tex = 100 K, the upper limit column density is ≤ 5.3 × 1014 cm−2.
NH2OH has three strong transitions at 352.522, 352.730, and 352.485 GHz for the 70 → 60, 71 → 61, 72 → 62 transitions, respectively. Slightly different RMS noise conditions apply around each of these transitions, resulting in a 3σ of 27, 21, and 27 mJy km s−1, respectively.The upper limit column density versus rotational temperature plot is shown in Fig. D.2. The transition at 352.522 GHz constrains the column density most, resulting in an upper limit column density of NH2OH of ≤ 3.7 × 1014 cm−2 at Tex = 100 K.
Table 1 lists the column densities and excitation temperatures for the five molecules under investigation in this work. For the three detected species the column density and excitation temperature ranges that can fit the emission are listed. For the non-detected species CH3NH2 and NH2OH the upper limit column density is determined for Tex = 100 K. The typical uncertainty of the column densities of these upper limits for a reasonable range of excitation temperatures is a factor of ~2 (see Appendix D).
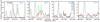 |
Fig. 1 All detected transitions of CH2NH in the PILS spectrum at one beam offset around source B (black), with the synthetic spectrum for Tex = 100 K and N = 8.0 × 1014 cm−2 (red) and other known species indicated in green. The upper state energy of each CH2 NH transition is indicated in blue. |
 |
Fig. 2 All detected transitions of NO in the PILS spectrum at one beam offset around source B (black), with the synthetic spectrum forTex = 100 K and N = 2.0 × 1016 cm−2 (red) and other known species indicated in green. The upper state energy of each NO transition is indicated in blue. |
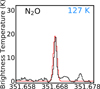 |
Fig. 3 The N2O transition identified in the PILS spectrum at one beam offset around source B (black), with the synthetic spectrum for Tex = 100 K and N = 5.0 × 1016 cm−2 (red). The upper state energy of the transition is indicated in blue. |
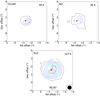 |
Fig. 4 Integrated emission maps of the 332.572 GHz line of CH2NH, the 351.052 GHz line of NO, and the 351.668 GHz line of N2O. The emission is integrated between 2.2 and 3.2 km s−1. The axes show the position offset from phase centre of the observations. Contour levels start at 30 mJy km s−1 and increase in steps of 45 mJy km s−1. The red star marks the peak continuum position and the black cross marks the one beam offset position where the spectra are analysed. |
Column densities and rotational temperatures at the one beam offset position around source B from the ALMA-PILS data.
4 Astrochemical implications
To put the results into context, the column density ratios between the molecules studied here and formamide (NH2CHO), methanol (CH3OH), and molecular hydrogen (H2) are computed and compared with other sources. The column densities of these reference species towards the same, one beam offset position in source B are: NH2CHO = 1 × 10¹⁶, CH3OH = 1 × 10¹⁹, and H2 > 1.2 × 1025 cm−2 (Coutens et al. 2016; Jørgensen et al. 2016). The H2 lower limit column density is determined towards the continuum peak position of source B, but the same lower limit shouldhold for the one beam offset position being analysed in this paper, where the dust emission is still optically thick. Earlier results for Orion KL and for some Sgr B2 studies, used to put our ratios into context, are based on single dish data, whereas in this work interferometric data are used. It is important to stress that differences in abundance ratios do not necessarily reflect chemical differences, but could arise from the fact that single dish observations generally probe larger spatial scales and are more affected by beam dilution (see Jørgensen et al. 2016).
The NH2OH upper limit abundance of N(NH2OH)/N(H2) ≤ 3.1 × 10⁻¹¹ found in this work is comparable to upper limit abundances found for high-mass sources by Pulliam et al. (2012), but significantly lower than the ice abundances of 7 × 10⁻⁹ N(H + H2) found with a dark cloud model in Fedoseev et al. (2012). One explanation could be that the reaction barriers in this model are too low or that destruction or competing pathways are missing. It could also be that the dominant pathway to NH2OH is a gas-phase formation route, although such a route would likely also be hindered by a large reaction barrier or subject to efficient destruction or competing pathways. The more extensive gas-grain model of Garrod (2013) also overpredicts this species, although the predicted abundance is lower by at least an order of magnitude. The full comparison of the hydroxylamine upper limit abundance compared with literature values is given in Table E.1. One example of missing destructions reactions is given by laboratory experiments which show that thermal processing of NH2OH:H2O mixtures results in the conversion of NH2OH into HNO, NH3, and O2 before the onset of desorption (Jonusas & Krim 2016). Also, UV processing of ice mixtures containing NH2OH results in the efficient destruction of this molecule (Fedoseev et al. 2016). The low gas-phase abundance of NH2OH limits its involvement in gas-phase production routes of amino acids.
The NO abundance in IRAS 16293B (N(NO)/N(H2) ≤ 1.7 × 10⁻⁹, given as an upper limit due to the lower limit H2 column density) is low compared to observational and modelling studies of dark clouds, where NO abundances of 10−8–10−6 are found (e.g. McGonagle et al. 1990; Visser et al. 2011). The IRAS 16293B abundance of NO is much more stringent than the NO upper limit of ≤3 × 10⁻⁷ derived towards the envelope of SVS13-A and also substantially lower than the NO abundance of (4− 7) × 10−6 towards the L1157-B1 shock (Codella et al. 2018). Modelling shows that NO is readily lost in the ice by conversion to other species, mainly NH2OH (Yıldız et al. 2013), and in the gas-phase by photodissociation reactions in the hot core (Visser et al. 2011) and thus could explain the depletion of NO in IRAS 16293B. The high N2O abundance may indicate other loss pathways of NO as well. N2O is found in laboratory ice experiments as a side product of NO hydrogenation and UV irradiation (Congiu et al. 2012; Fedoseev et al. 2012, 2016) and suggested to form via the reaction NO + NH in warm gas (Halfen et al. 2001). The N(NO)/N(N2O) ≤ 0.5 ratio hints to a scenario where NO is at least partly converted to N2O in the ice and/or gas surrounding IRAS 16293B. Interestingly the abundance ratio in IRAS 16293B contrasts with other known abundances toward Sgr B2, which have N(NO)/N(N2O) ~ 10 (Ziurys et al. 1994; Halfen et al. 2001), see Table 2.
Table 3 lists the abundance ratios of CH3NH2 in IRAS 16293B, Sgr B2 and hot core models by Garrod et al. (2008) and Garrod (2013). The abundance ratios of CH3NH2/CH2NH are slightly lower in IRAS 16293B compared to Sgr B2 and the models of Garrod (2013), but ratios with respect to NH2CHO and CH3OH are lower by at least one to two orders of magnitude. Abundances of CH2NH relative to NH2CHO, CH3OH, and H2 are given in Table 4. The observed CH2NH/NH2CHO abundance ratio in IRAS 16293B is lower than that in Sgr B2, but in range of model predictions. This can indicate that NH2CHO is overpredicted in the models. The ratios with respect to CH3OH and H2 are in most cases at least an order of magnitude lower in IRAS 16293B compared to Sgr B2 and models. The comparison of these abundances indicates that the formation of both CH3NH2 and CH2NH is less efficient in the low-mass source IRAS 16293B and overpredicted in models.
CH3NH2 was mass spectrometrically detected on the comet 67P/C–G (Goesmann et al. 2015). However, the recent detection with the ROSINA-DFMS instrument indicates that it is present at a lower abundance, below the 1% level with respect to water, than initially thought (Altwegg et al. 2017), resulting in a CH3NH2/H2O abundance of 1.2 × 10⁻⁴. Since IRAS 16293B is assumed to resemble an early formation stage of our solar system, the low abundance of CH3NH2 in 67P/C–G and non-detection in IRAS 16293B suggest that CH3NH2 is not efficiently formed in these environments. Furthermore, the low abundance of CH3NH2 limits the relevance of amino acid formation routes involving this species. Conversely, the detection of CH2NH makes amino acid formation routes involving this molecule a more likely possibility.
Comparison of NO and N2O abundances at one beam offset around source B.
Comparison of CH3NH2 abundances at one beam offset around source B.
Comparison of CH2NH abundances at one beam offset around source B.
Acknowledgements
We would like to thank the anonymous referee for the useful inputs given to this paper. This letter makes use of the following ALMA data: ADS/JAO.ALMA#2013.1.00278.S. ALMA is a partnership of ESO (representing its member states), NSF (USA), and NINS (Japan), together with NRC (Canada) and NSC and ASIAA (Taiwan), in cooperation with the Republic of Chile. The Joint ALMA Observatory is operated by ESO, AUI/NRAO and NAOJ. Astrochemistry in Leiden is supported by the European Union A-ERC grant 291141 CHEMPLAN, by the Netherlands Research School for Astronomy (NOVA) and by a Royal Netherlands Academy of Arts and Sciences (KNAW) professor prize. The group of J.K.J. acknowledges support from a Lundbeck Foundation Group Leader Fellowship, as well as the ERC under the European Union’s Horizon 2020 research and innovation programme through ERC Consolidator Grant S4F (grant agreement No. 646908). Research at the Centre for Star and Planet Formation is funded by the Danish National Research Foundation. A.C. postdoctoral grant is funded by the ERC Starting Grant 3DICE (grant agreement 336474). M.N.D. acknowledges the financial support of the Center for Space and Habitability (CSH) Fellowship and the IAU Gruber Foundation Fellowship.
Appendix A Spectroscopic data
Table A.1 lists the transitions of NO, N2O, and CH2NH detected towards IRAS 16293B. Columns seven through ten list the line FWHM, peak velocity Vpeak, line opacity τ and peak brightness temperatureTpeak for each transition, based on the synthetic spectra at 100 K. The final column indicates if a line is partially blended with a neighboring line. The error on Vpeak is the velocity resolution of 0.2 km s−1. The line FWHM is kept as a fixed parameter at 1 km s−1. The error inthe peak brightness is given by the calibration uncertainty and RMS noise, as indicated in Sect. 2.
Detected lines of NO, N2O, and CH2 NH.
Appendix B Additional fit spectra of CH2NH and NO
Figure B.1 shows CH2NH synthetic spectra at Tex = 50 and 150 K. Best fit column densities of 7 × 10¹⁴ and 8 × 1014 cm−2, respectively, are found. However, clear discrepancies in the fits exist, which are especially visible for the transitions at 340.354 and 351.454 GHz.
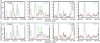 |
Fig. B.1 Fit models (red) of CH2NH at Tex = 50 K (top panels) and Tex = 150 K (bottom panels) overplotted on the PILS data (black) and other detected species in PILS given in green. Upper state energies of the CH2NH transitions are indicated in blue. |
Figure B.2 shows the NO synthetic spectrum at Tex = 150 K and Ntot = 2.3 × 1016 cm−2. The transitions at Eup = 36 K arewell fitted, however, clear anti-coincidences start to arise at the transitions of Eup = 209 K, as can be seen for the transitions at 360.935 and 360.941 GHz. Excitation temperatures for NO are therefore, constrained to Tex < 150 K.
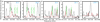 |
Fig. B.2 Fit models (red) of NO at Tex = 150 K overplotted on the PILS data (black) and other detected species in PILS given in green. Upper state energies of the NO transitions are indicated in blue. |
Appendix C N2O fit of TIMASSS data set
 |
Fig. C.1 Gaussian fits (red) of unblended N2O transitions in the single-dish TIMASSS data (black) by Caux et al. (2011). Upper state energies of the transitions are indicated in blue. |
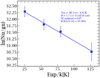 |
Fig. C.2 Rotational temperature diagram of the four unblended N2O transitions found in the TIMASSS dataset, resulting in Tex = 68 K and N = 1.7 × 1016 cm−2, for a source size of 1.′′6. |
Figure C.1 shows the four unblended lines of N2O detected in the TIMASSS survey. All these transitions are velocity shifted to Vpeak = 2.5 km s−1. Gaussian profiles were fitted and line widths are found between 1.4 and 3.3 km s−1, consistent with other FWHMs found in TIMASSS data for source B (Caux et al. 2011). The N2O transition at 226.95 GHz is fitted with a second Gaussian to properly account for the contribution of a nearby methylformate (CH3OCHO) transition. From the fits a rotational temperature diagram is created, shown in Fig. C.2. The diagram gives Tex = 68 K and N = 1.7 × 1016 cm−2, using a source size of 1.′′6 (see text). Variations in source size will change the excitation temperature and column density slightly.
Appendix D Upper limit column densities of NH2OH and CH3NH2
Upper limit column densities of NH2OH and CH3NH2 have been determined for excitation temperatures between 10 and 300 K. These are plotted in Figures D.1 and D.2. The upper limit column densities of NH2OH are determined on the three transitions: 70 → 60, 71 → 61, 72 → 62 transitions at 352 522, 352 730, and 352 485 MHz, respectively. These transitions are modelled with a 3σ line intensity of 27, 21, and 27 mJy km s−1, respectively. The upper limit column densities of CH3NH2 are determined on the 65 → 50 transition at 357 440 MHz fora 3σ line intensity of 23 mJy km s−1.
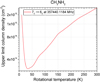 |
Fig. D.1 Upper limit column density for the strongest CH3NH2 transition as function of Tex. A 3σ value of 23 mJy km s−1 is used. |
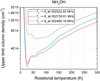 |
Fig. D.2 Upper limit column densities for the three strongest NH2OH transitions as function of Tex. 3σ values of 27, 21, and 27 mJy km s−1 are used for the respective lines. |
Appendix E Comparison of NH2OH upper limits
Upper limit abundance ratios for hydroxylamine in IRAS16293–2422.
References
- Altwegg, K., Balsiger, H., Bar-Nun, A., et al. 2016, Sci. Adv., 2, e1600285 [NASA ADS] [CrossRef] [Google Scholar]
- Altwegg, K., Balsiger, H., Berthelier, J. J., et al. 2017, MNRAS, 469, S130 [Google Scholar]
- Barrientos, C., Redondo, P., Largo, L., Rayón, V. M., & Largo, A. 2012, ApJ, 748, 99 [NASA ADS] [CrossRef] [Google Scholar]
- Belloche, A., Müller, H. S. P., Menten, K. M., Schilke, P., & Comito, C. 2013, A&A, 559, A47 [NASA ADS] [CrossRef] [EDP Sciences] [Google Scholar]
- Blagojevic, V., Petrie, S., & Bohme, D. K. 2003, MNRAS, 339, L7 [NASA ADS] [CrossRef] [Google Scholar]
- Bossa, J.-B., Duvernay, F., Theulé, P., et al. 2009, A&A, 506, 601 [NASA ADS] [CrossRef] [EDP Sciences] [Google Scholar]
- Caux, E., Kahane, C., Castets, A., et al. 2011, A&A, 532, A23 [NASA ADS] [CrossRef] [EDP Sciences] [Google Scholar]
- Codella, C., Viti, S., Lefloch, B., et al. 2018, MNRAS, 474, 5694 [NASA ADS] [CrossRef] [Google Scholar]
- Congiu, E., Fedoseev, G., Ioppolo, S., et al. 2012, ApJ, 750, L12 [NASA ADS] [CrossRef] [Google Scholar]
- Coutens, A., Jørgensen, J. K., van der Wiel, M. H. D., et al. 2016, A&A, 590, L6 [Google Scholar]
- Crockett, N. R., Bergin, E. A., Neill, J. L., et al. 2014, ApJ, 787, 112 [NASA ADS] [CrossRef] [Google Scholar]
- Danger, G., Borget, F., Chomat, M., et al. 2011, A&A, 535, A47 [NASA ADS] [CrossRef] [EDP Sciences] [Google Scholar]
- Dickens, J. E., Irvine, W. M., DeVries, C. H., & Ohishi, M. 1997, ApJ, 479, 307 [NASA ADS] [CrossRef] [PubMed] [Google Scholar]
- Elsila, J. E., Glavin, D. P., & Dworkin, J. P. 2009, Meteorit. Planet. Sci., 44, 1323 [NASA ADS] [CrossRef] [Google Scholar]
- Fedoseev, G., Ioppolo, S., Lamberts, T., et al. 2012, J. Chem. Phys., 137, 054714 [NASA ADS] [CrossRef] [Google Scholar]
- Fedoseev, G., Chuang, K.-J., van Dishoeck, E. F., Ioppolo, S., & Linnartz, H. 2016, MNRAS, 460, 4297 [NASA ADS] [CrossRef] [Google Scholar]
- Förstel, M., Bergantini, A., Maksyutenko, P., Góbi, S., & Kaiser, R. I. 2017, ApJ, 845, 83 [NASA ADS] [CrossRef] [Google Scholar]
- Garrod, R. T. 2013, ApJ, 765, 60 [Google Scholar]
- Garrod, R. T., Widicus Weaver, S. L., & Herbst, E. 2008, ApJ, 682, 283 [NASA ADS] [CrossRef] [Google Scholar]
- Goesmann, F., Rosenbauer, H., Bredehoft, J. H., et al. 2015, Science, 349, aab0689 [Google Scholar]
- Halfen, D. T., Apponi, A. J., & Ziurys, L. M. 2001, ApJ, 561, 244 [NASA ADS] [CrossRef] [Google Scholar]
- Halfen, D. T., Ilyushin, V. V., & Ziurys, L. M. 2013, ApJ, 767, 66 [NASA ADS] [CrossRef] [Google Scholar]
- He, J., Vidali, G., Lemaire, J.-L., & Garrod, R. T. 2015, ApJ, 799, 49 [NASA ADS] [CrossRef] [Google Scholar]
- Holtom, P. D., Bennett, C. J., Osamura, Y., Mason, N. J., & Kaiser, R. I. 2005, ApJ, 626, 940 [NASA ADS] [CrossRef] [Google Scholar]
- Ilyushin, V. V., Alekseev, E. A., Dyubko, S. F., Motiyenko, R. A., & Hougen, J. T. 2005, J. Mol. Spectrosc., 229, 170 [NASA ADS] [CrossRef] [Google Scholar]
- Jonusas, M., & Krim, L. 2016, MNRAS, 459, 1977 [NASA ADS] [CrossRef] [Google Scholar]
- Jørgensen, J. K., van der Wiel, M. H. D., Coutens, A., et al. 2016, A&A, 595, A117 [NASA ADS] [CrossRef] [EDP Sciences] [Google Scholar]
- Jørgensen, J. K., Calcutt, H., & Müller, H. S. P. 2018, A&A, submitted [arXiv:1808.08753] [Google Scholar]
- Kaifu, N., Morimoto, M., Nagane, K., et al. 1974, ApJ, 191, L135 [NASA ADS] [CrossRef] [Google Scholar]
- Kim, Y. S., & Kaiser, R. I. 2011, ApJ, 729, 68 [NASA ADS] [CrossRef] [EDP Sciences] [Google Scholar]
- Kirchhoff, W. H., Johnson, D. R., & Lovas, F. J. 1973, J. Phys. Chem. Ref. Data, 2, 1 [NASA ADS] [CrossRef] [Google Scholar]
- Ligterink, N. F. W., Tenenbaum, E. D., & van Dishoeck, E. F. 2015, A&A, 576, A35 [NASA ADS] [CrossRef] [EDP Sciences] [Google Scholar]
- Ligterink, N. F. W., Coutens, A., Kofman, V., et al. 2017, MNRAS, 469, 2219 [NASA ADS] [CrossRef] [Google Scholar]
- Liszt, H. S., & Turner, B. E. 1978, ApJ, 224, L73 [NASA ADS] [CrossRef] [Google Scholar]
- Lykke, J. M., Coutens, A., Jørgensen, J. K., et al. 2017, A&A, 597, A53 [NASA ADS] [CrossRef] [EDP Sciences] [Google Scholar]
- McGonagle, D., Irvine, W. M., Minh, Y. C., & Ziurys, L. M. 1990, ApJ, 359, 121 [NASA ADS] [CrossRef] [Google Scholar]
- McGuire, B. A., Carroll, P. B., Dollhopf, N. M., et al. 2015, ApJ, 812, 76 [NASA ADS] [CrossRef] [Google Scholar]
- Milam, S. N., Savage, C., Brewster, M. A., Ziurys, L. M., & Wyckoff, S. 2005, ApJ, 634, 1126 [NASA ADS] [CrossRef] [Google Scholar]
- Morino, I., Yamada, K., Klein, H., et al. 2000, J. Mol. Struct., 517, 367 [NASA ADS] [CrossRef] [Google Scholar]
- Müller, H. S. P., Thorwirth, S., Roth, D. A., & Winnewisser, G. 2001, A&A, 370, L49 [NASA ADS] [CrossRef] [EDP Sciences] [Google Scholar]
- Müller, H. S. P., Schlöder, F., Stutzki, J., & Winnewisser, G. 2005, J. Mol. Struct., 742, 215 [NASA ADS] [CrossRef] [Google Scholar]
- Neill, J. L., Bergin, E. A., Lis, D. C., et al. 2014, ApJ, 789, 8 [NASA ADS] [CrossRef] [Google Scholar]
- Nummelin, A., Bergman, P., Hjalmarson, A., et al. 2000, Doktorsavhandlingar vid Chalmers Tekniska Hogskola, 2 [Google Scholar]
- Pagani, L., Favre, C., Goldsmith, P. F., et al. 2017, A&A, 604, A32 [NASA ADS] [CrossRef] [EDP Sciences] [Google Scholar]
- Persson, M. V., Jørgensen, J. K., Müller, H. S. P., et al. 2018, A&A, 610, A54 [NASA ADS] [CrossRef] [EDP Sciences] [Google Scholar]
- Pickett, H. M., Cohen, E. A., Waters, J. W., & Phillips, T. G. 1979, 34th International Symposium on Molecular Spectroscopy, Columbus, OH, USA [Google Scholar]
- Pickett, H. M., Poynter, R. L., Cohen, E. A., et al. 1998, J. Quant. Spec. Radiat. Transf., 60, 883 [Google Scholar]
- Pulliam, R. L., McGuire, B. A., & Remijan, A. J. 2012, ApJ, 751, 1 [NASA ADS] [CrossRef] [Google Scholar]
- Snow, J. L., Orlova, G., Blagojevic, V., & Bohme, D. K. 2007, J. Am. Chem. Soc., 129, 9910 [CrossRef] [PubMed] [Google Scholar]
- Suzuki, T., Ohishi, M., Hirota, T., et al. 2016, ApJ, 825, 79 [NASA ADS] [CrossRef] [Google Scholar]
- Theule, P., Borget, F., Mispelaer, F., et al. 2011, A&A, 534, A64 [NASA ADS] [CrossRef] [EDP Sciences] [Google Scholar]
- Ting, W.-J., Chang, C.-H., Chen, S.-E., et al. 2014, J. Opt. Soc. Am. B Opt. Phys., 31, 1954 [NASA ADS] [CrossRef] [Google Scholar]
- Turner, B. E. 1991, ApJS, 76, 617 [NASA ADS] [CrossRef] [Google Scholar]
- Visser, R., Doty, S. D., & van Dishoeck E. F. 2011, A&A, 534, A132 [NASA ADS] [CrossRef] [EDP Sciences] [Google Scholar]
- Wilson, T. L. 1999, Rep. Prog. Phys., 62, 143 [Google Scholar]
- Woon, D. E. 2002, ApJ, 571, L177 [NASA ADS] [CrossRef] [Google Scholar]
- Yıldız, U. A., Acharyya, K., Goldsmith, P. F., et al. 2013, A&A, 558, A58 [NASA ADS] [CrossRef] [EDP Sciences] [Google Scholar]
- Zheng, W., & Kaiser, R. I. 2010, J. Phys. Chem. A, 114, 5251 [CrossRef] [Google Scholar]
- Ziurys, L. M., Apponi, A. J., Hollis, J. M., & Snyder, L. E. 1994, ApJ, 436, L181 [NASA ADS] [CrossRef] [Google Scholar]
All Tables
Column densities and rotational temperatures at the one beam offset position around source B from the ALMA-PILS data.
All Figures
|
Fig. 1 All detected transitions of CH2NH in the PILS spectrum at one beam offset around source B (black), with the synthetic spectrum for Tex = 100 K and N = 8.0 × 1014 cm−2 (red) and other known species indicated in green. The upper state energy of each CH2 NH transition is indicated in blue. |
| In the text | |
|
Fig. 2 All detected transitions of NO in the PILS spectrum at one beam offset around source B (black), with the synthetic spectrum forTex = 100 K and N = 2.0 × 1016 cm−2 (red) and other known species indicated in green. The upper state energy of each NO transition is indicated in blue. |
| In the text | |
|
Fig. 3 The N2O transition identified in the PILS spectrum at one beam offset around source B (black), with the synthetic spectrum for Tex = 100 K and N = 5.0 × 1016 cm−2 (red). The upper state energy of the transition is indicated in blue. |
| In the text | |
|
Fig. 4 Integrated emission maps of the 332.572 GHz line of CH2NH, the 351.052 GHz line of NO, and the 351.668 GHz line of N2O. The emission is integrated between 2.2 and 3.2 km s−1. The axes show the position offset from phase centre of the observations. Contour levels start at 30 mJy km s−1 and increase in steps of 45 mJy km s−1. The red star marks the peak continuum position and the black cross marks the one beam offset position where the spectra are analysed. |
| In the text | |
|
Fig. B.1 Fit models (red) of CH2NH at Tex = 50 K (top panels) and Tex = 150 K (bottom panels) overplotted on the PILS data (black) and other detected species in PILS given in green. Upper state energies of the CH2NH transitions are indicated in blue. |
| In the text | |
|
Fig. B.2 Fit models (red) of NO at Tex = 150 K overplotted on the PILS data (black) and other detected species in PILS given in green. Upper state energies of the NO transitions are indicated in blue. |
| In the text | |
|
Fig. C.1 Gaussian fits (red) of unblended N2O transitions in the single-dish TIMASSS data (black) by Caux et al. (2011). Upper state energies of the transitions are indicated in blue. |
| In the text | |
|
Fig. C.2 Rotational temperature diagram of the four unblended N2O transitions found in the TIMASSS dataset, resulting in Tex = 68 K and N = 1.7 × 1016 cm−2, for a source size of 1.′′6. |
| In the text | |
|
Fig. D.1 Upper limit column density for the strongest CH3NH2 transition as function of Tex. A 3σ value of 23 mJy km s−1 is used. |
| In the text | |
|
Fig. D.2 Upper limit column densities for the three strongest NH2OH transitions as function of Tex. 3σ values of 27, 21, and 27 mJy km s−1 are used for the respective lines. |
| In the text | |
Current usage metrics show cumulative count of Article Views (full-text article views including HTML views, PDF and ePub downloads, according to the available data) and Abstracts Views on Vision4Press platform.
Data correspond to usage on the plateform after 2015. The current usage metrics is available 48-96 hours after online publication and is updated daily on week days.
Initial download of the metrics may take a while.