Fig. 4
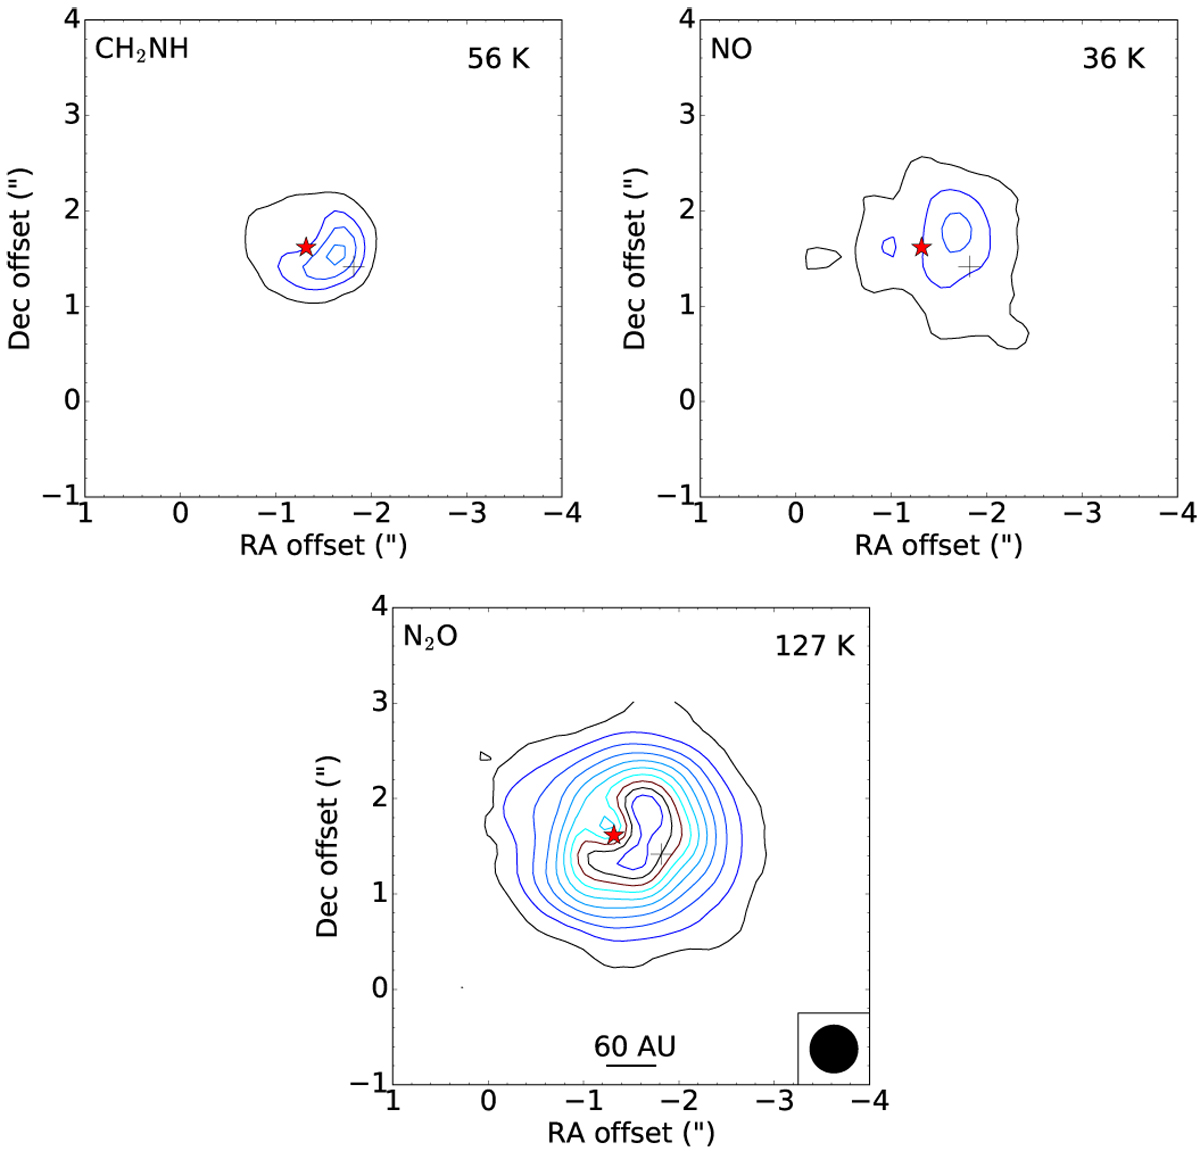
Integrated emission maps of the 332.572 GHz line of CH2NH, the 351.052 GHz line of NO, and the 351.668 GHz line of N2O. The emission is integrated between 2.2 and 3.2 km s−1. The axes show the position offset from phase centre of the observations. Contour levels start at 30 mJy km s−1 and increase in steps of 45 mJy km s−1. The red star marks the peak continuum position and the black cross marks the one beam offset position where the spectra are analysed.
Current usage metrics show cumulative count of Article Views (full-text article views including HTML views, PDF and ePub downloads, according to the available data) and Abstracts Views on Vision4Press platform.
Data correspond to usage on the plateform after 2015. The current usage metrics is available 48-96 hours after online publication and is updated daily on week days.
Initial download of the metrics may take a while.