Fig. 2.
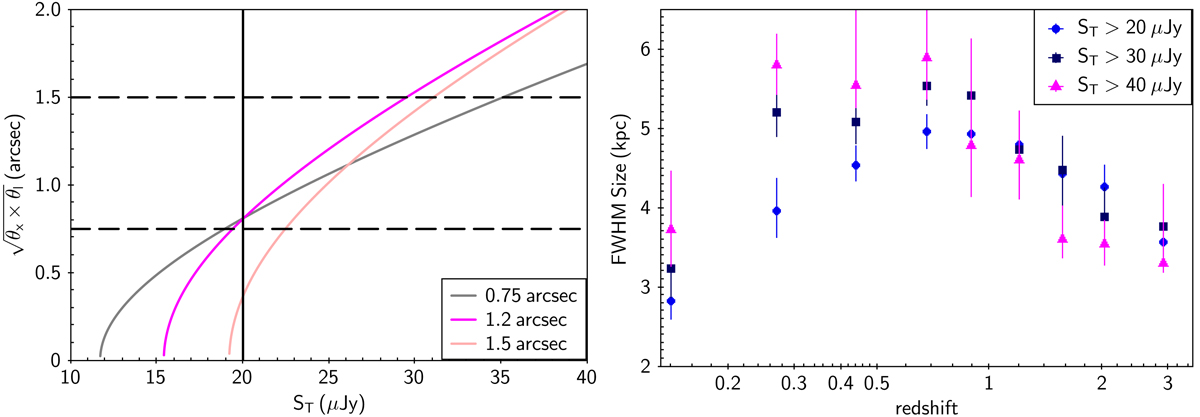
Left panel: maximum detectable angular size resulting from the combined effects of r.m.s sensitivity and total flux density selection limit for images with 0.″75 (grey line), 1.″2 (magenta line) and 1.″5 resolution (pink line). The maximum angular size is estimated from the ratio ST/5σ using the geometric mean of the two limiting cases (see text). Right panel: redshift evolution of the median linear sizes of three different samples of SFGs: the blue points are the same as in Fig. 1 and correspond to radio sources with 3 GHz total flux density ST > 20 μJy, while the purple squares and magenta triangles correspond to subsamples with ST > 30 μJy and ST > 40 μJy, respectively.
Current usage metrics show cumulative count of Article Views (full-text article views including HTML views, PDF and ePub downloads, according to the available data) and Abstracts Views on Vision4Press platform.
Data correspond to usage on the plateform after 2015. The current usage metrics is available 48-96 hours after online publication and is updated daily on week days.
Initial download of the metrics may take a while.