Free Access
Fig. 5.
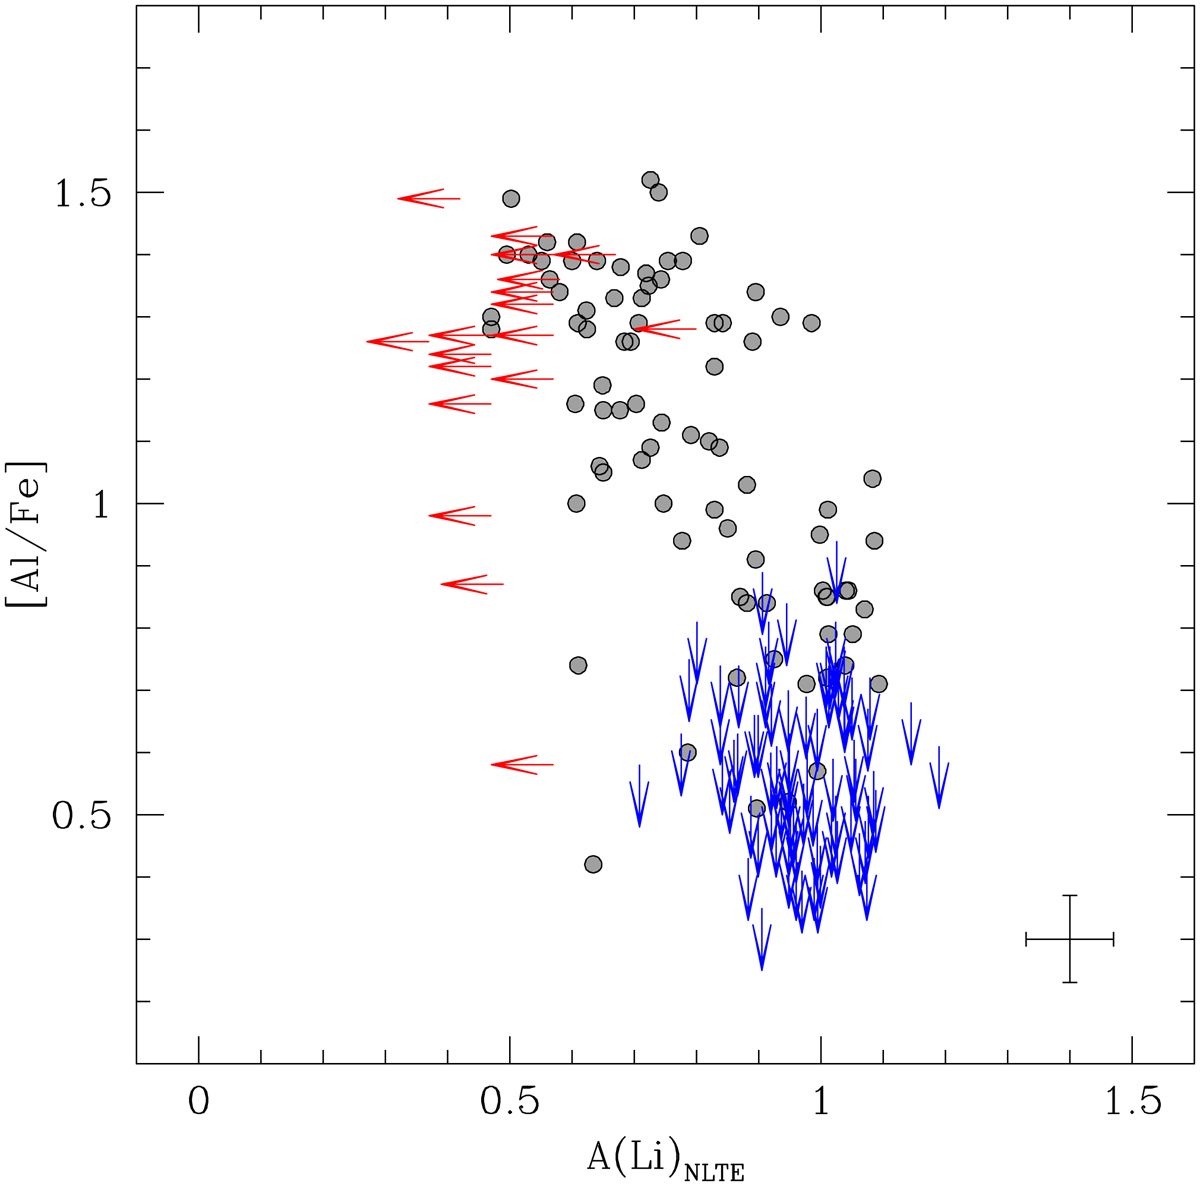
Behaviour of [Al/Fe] as a function of A(Li) for the entire spectroscopic sample studied in this work (gray circles). Red arrows indicate the upper limits for A(Li), blue arrows show the upper limits for Al.
Current usage metrics show cumulative count of Article Views (full-text article views including HTML views, PDF and ePub downloads, according to the available data) and Abstracts Views on Vision4Press platform.
Data correspond to usage on the plateform after 2015. The current usage metrics is available 48-96 hours after online publication and is updated daily on week days.
Initial download of the metrics may take a while.