Fig. 1.
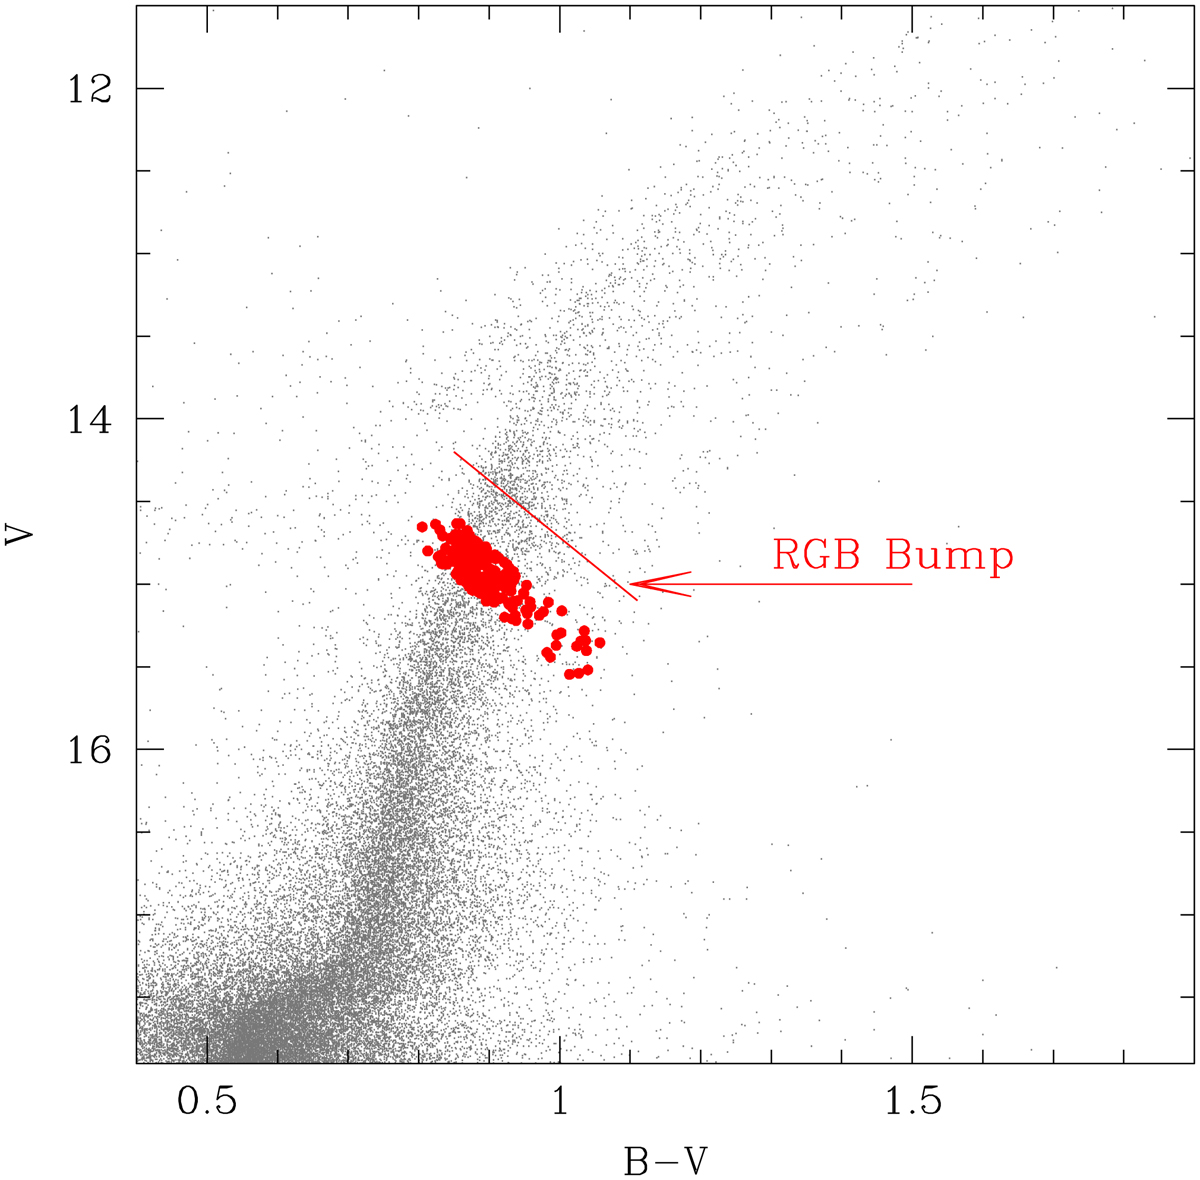
Colour-magnitude diagram of Omega Centauri (Bellini et al. 2009, stars selected within 750 arcsec from the cluster centre). The position of the spectroscopic targets (red circles) and the mean locus (red line) of the RGB bump of the various stellar populations of Omega Centauri are shown.
The paper is structured as follows: Sect. 2 describes the observations and selection of the member stars of Omega Centauri; Sect. 3 describes the adopted procedure for the chemical analysis; and the results are presented in Sects. 4–6 and discussed in Sect. 7.
Current usage metrics show cumulative count of Article Views (full-text article views including HTML views, PDF and ePub downloads, according to the available data) and Abstracts Views on Vision4Press platform.
Data correspond to usage on the plateform after 2015. The current usage metrics is available 48-96 hours after online publication and is updated daily on week days.
Initial download of the metrics may take a while.