Free Access
Fig. 8.
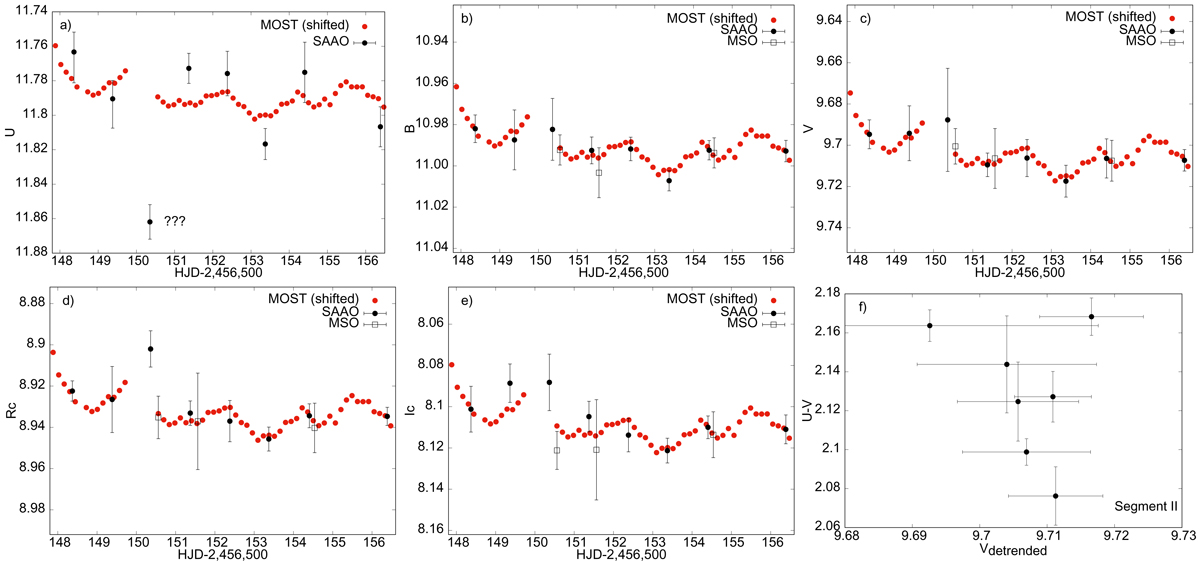
Comparison of Segment II of the MOST light curve with UBVRcIcRI data obtained at ground-based observatories. Last panel: V − (U − V) diagram for this segment; the diagram indicates on larger variability amplitude in U- than in V filter.
Current usage metrics show cumulative count of Article Views (full-text article views including HTML views, PDF and ePub downloads, according to the available data) and Abstracts Views on Vision4Press platform.
Data correspond to usage on the plateform after 2015. The current usage metrics is available 48-96 hours after online publication and is updated daily on week days.
Initial download of the metrics may take a while.