Free Access
Fig. 5.
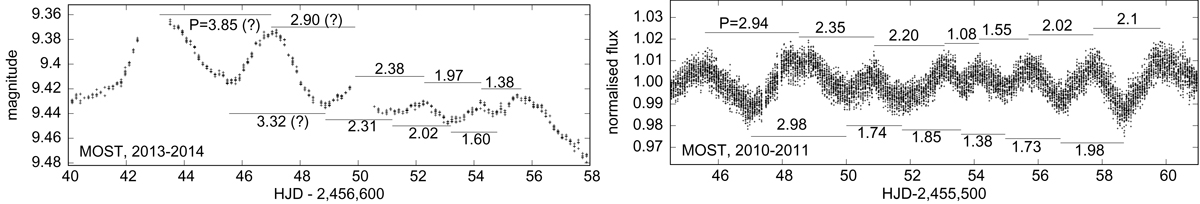
Short-periodic fragments of 2013 and 2010 MOST light curves. In both cases maxima and minima were localised by eye to about 0.02 d, which leads to the 0.04 d uncertainty of each indicated temporal period P value. Modulations seen at the beginning are marked by “?” as they occurred prior the official start of Segment II.
Current usage metrics show cumulative count of Article Views (full-text article views including HTML views, PDF and ePub downloads, according to the available data) and Abstracts Views on Vision4Press platform.
Data correspond to usage on the plateform after 2015. The current usage metrics is available 48-96 hours after online publication and is updated daily on week days.
Initial download of the metrics may take a while.