Free Access
Fig. 3.
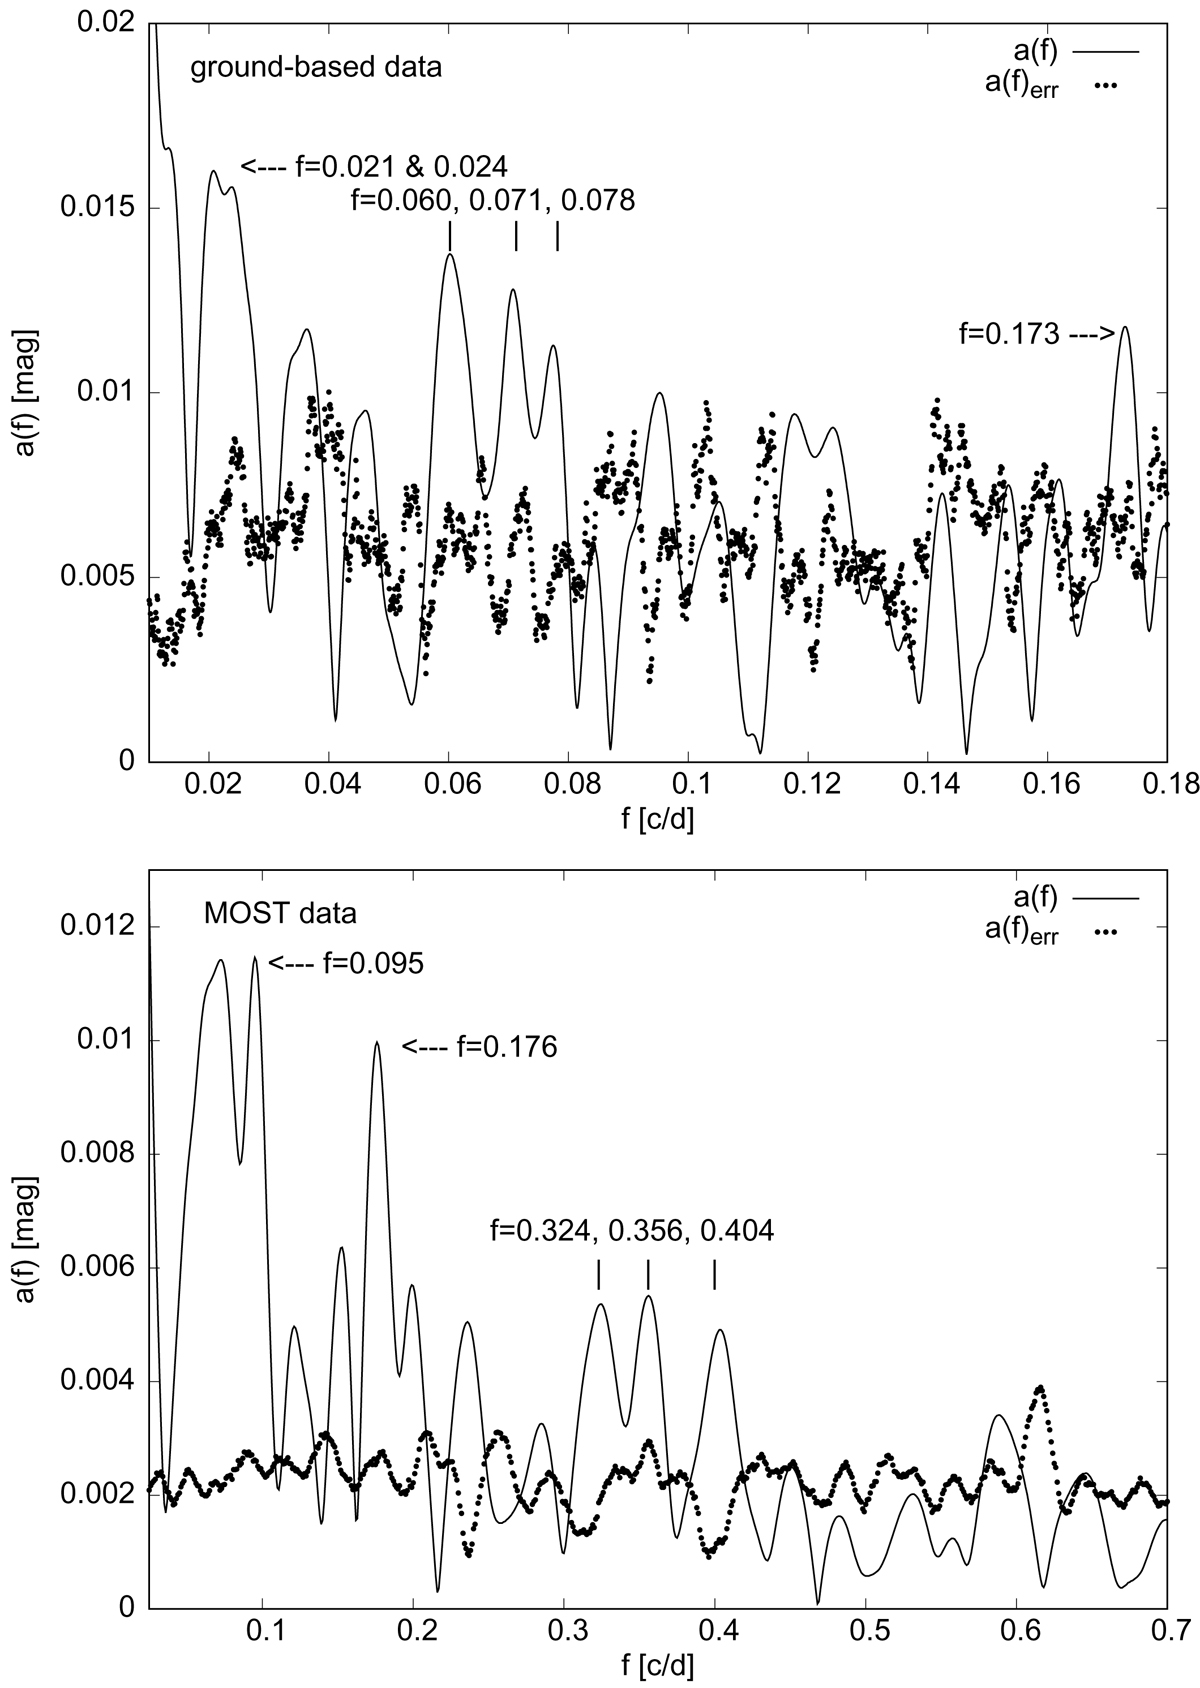
Results of Fourier analysis of ground-based (upper panel) and MOST (lower panel) data in form of the amplitude a(f) vs. the frequency (f) are shown as continuous lines. The amplitude errors, determined from bootstrap sampling, are shown as dots.
Current usage metrics show cumulative count of Article Views (full-text article views including HTML views, PDF and ePub downloads, according to the available data) and Abstracts Views on Vision4Press platform.
Data correspond to usage on the plateform after 2015. The current usage metrics is available 48-96 hours after online publication and is updated daily on week days.
Initial download of the metrics may take a while.