Fig. 11.
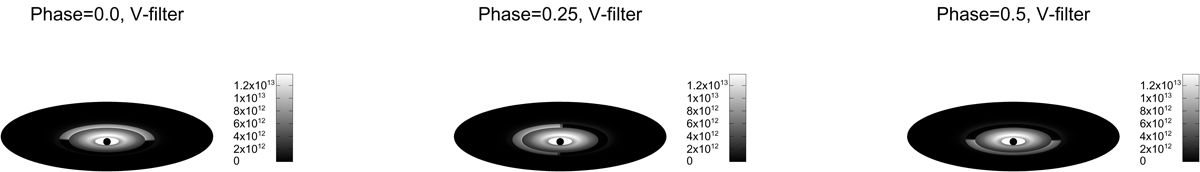
Picture proposed for a qualitative explanation of the Segment I variability. The lighter semi-ring represents the 16–20 R⊙ disc inhomogeneity in three rotational phases. The disc fluxes calculated for V filter are expressed in greyscales (as defined on respective bars) and are left in temporary model units; they are also slightly affected by limitations of our plotting software. The stellar flux is expressed arbitrarily; the stellar radius was set to 1.5 R⊙.
Current usage metrics show cumulative count of Article Views (full-text article views including HTML views, PDF and ePub downloads, according to the available data) and Abstracts Views on Vision4Press platform.
Data correspond to usage on the plateform after 2015. The current usage metrics is available 48-96 hours after online publication and is updated daily on week days.
Initial download of the metrics may take a while.