Fig. 10.
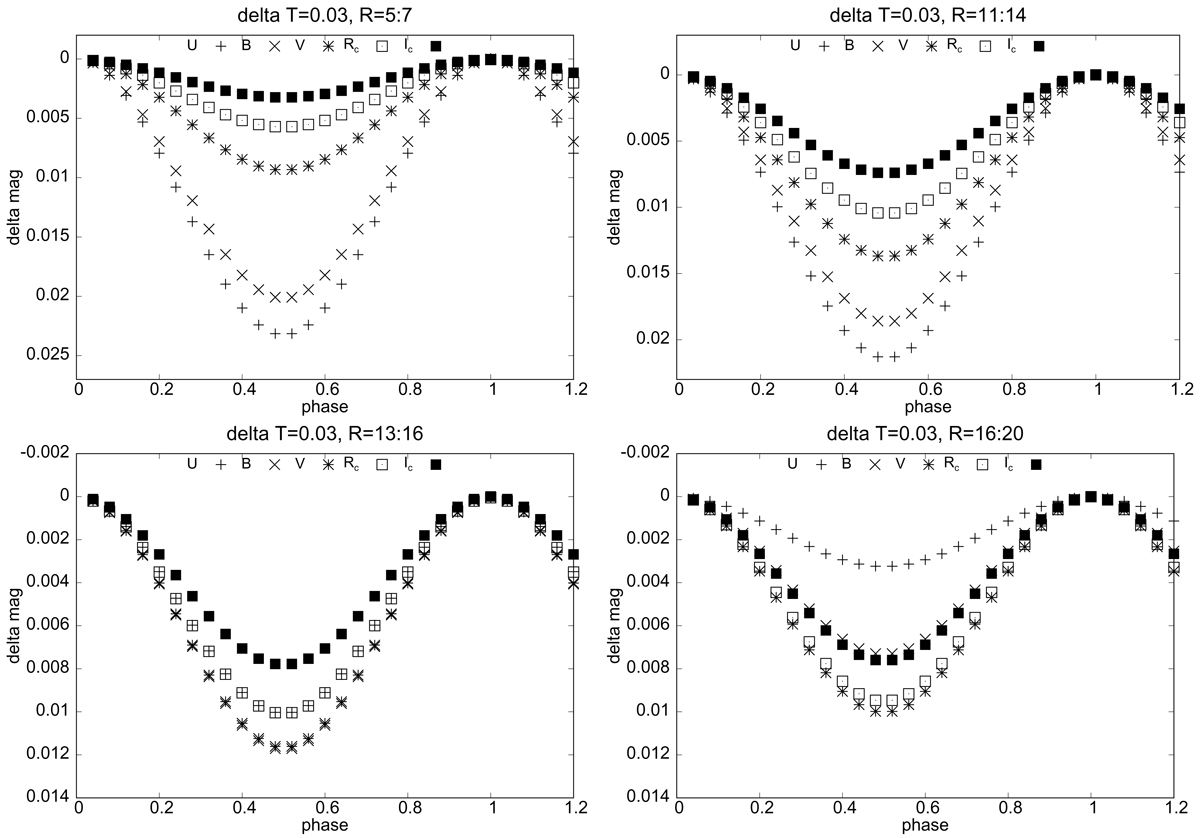
Sample of synthetic light curves in UBVRcIc filters used during the localisation process of Segment II light variations. Most similar amplitudes in BVRcIc filters are obtained for disc inhomogeneities located between 13 and 20 R⊙, but the slightly higher amplitude in the U filter may suggest somewhat closer localisation, from 12 to 15 R⊙. The values used in a given model (ΔT, ![]() and
and ![]() ) are given at the top of each panel.
) are given at the top of each panel.
Current usage metrics show cumulative count of Article Views (full-text article views including HTML views, PDF and ePub downloads, according to the available data) and Abstracts Views on Vision4Press platform.
Data correspond to usage on the plateform after 2015. The current usage metrics is available 48-96 hours after online publication and is updated daily on week days.
Initial download of the metrics may take a while.