Fig. 1.
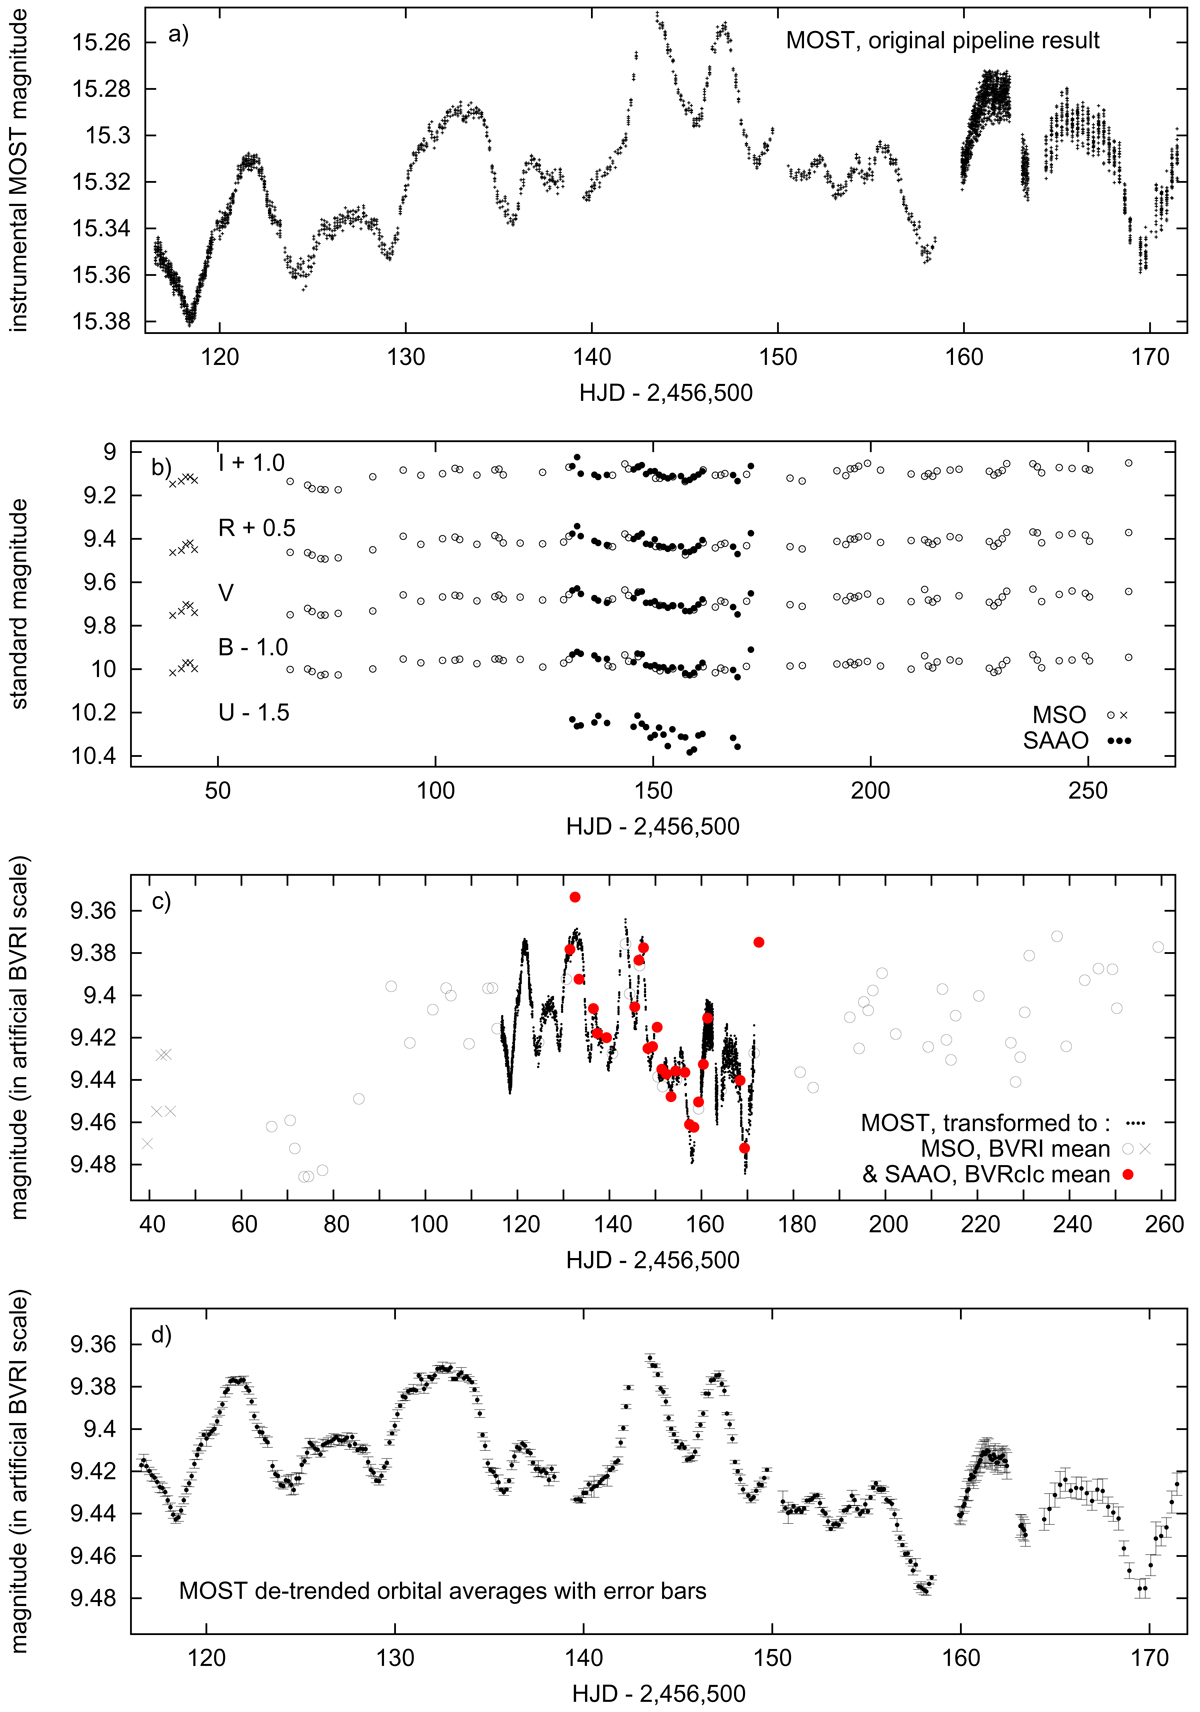
First panel: 2013–2014 MOST light curve of FU Ori provided by the pipeline. The standardised SAAO UBVRcIc (filled circles) and aligned MSO BVRI light curves (open circles and crosses) are shown in the second panel. Third panel: averaged SAAO BVRcIc (filled circles) and MSO BVRI (open circles) observations used for correction of the instrumental trend in the original MOST data, as described in Sect. 2.1. The de-trended MOST data are plotted in the same panel. Fourth panel: de-trended MOST data in the form of orbital averages with error bars (σ).
Current usage metrics show cumulative count of Article Views (full-text article views including HTML views, PDF and ePub downloads, according to the available data) and Abstracts Views on Vision4Press platform.
Data correspond to usage on the plateform after 2015. The current usage metrics is available 48-96 hours after online publication and is updated daily on week days.
Initial download of the metrics may take a while.