Fig. 4.
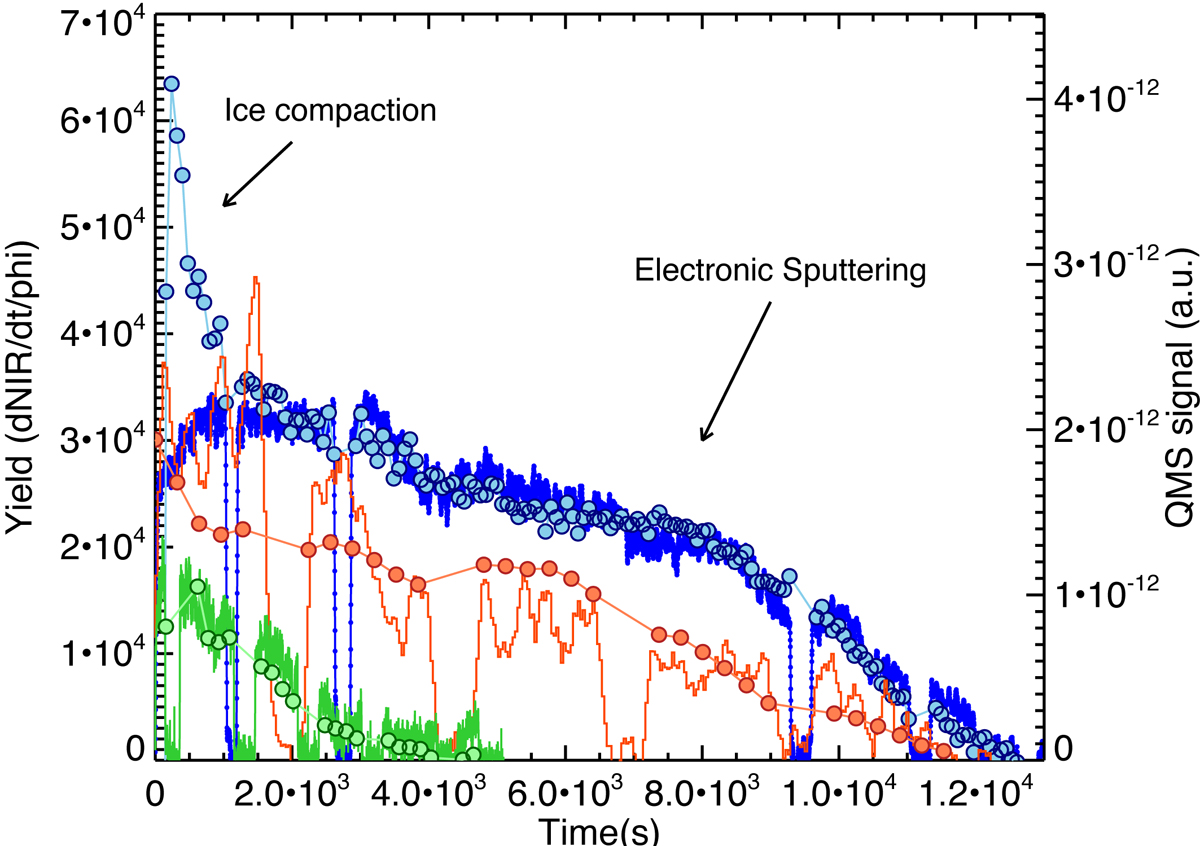
Temporal evolution of the signal recorded with the QMS at mass 18 for three of the experiments (lines), scaled and compared to the derivative of the IR signal with respect to the ion flux (circles). The colours correspond to the experiments summarised in Table 1: orange (27W1), green (27W3), blue (30W2). The breaks correspond to ion beam stops in order to monitor properly the mass spectrometer background signal evolution.
Current usage metrics show cumulative count of Article Views (full-text article views including HTML views, PDF and ePub downloads, according to the available data) and Abstracts Views on Vision4Press platform.
Data correspond to usage on the plateform after 2015. The current usage metrics is available 48-96 hours after online publication and is updated daily on week days.
Initial download of the metrics may take a while.