Fig. 2.
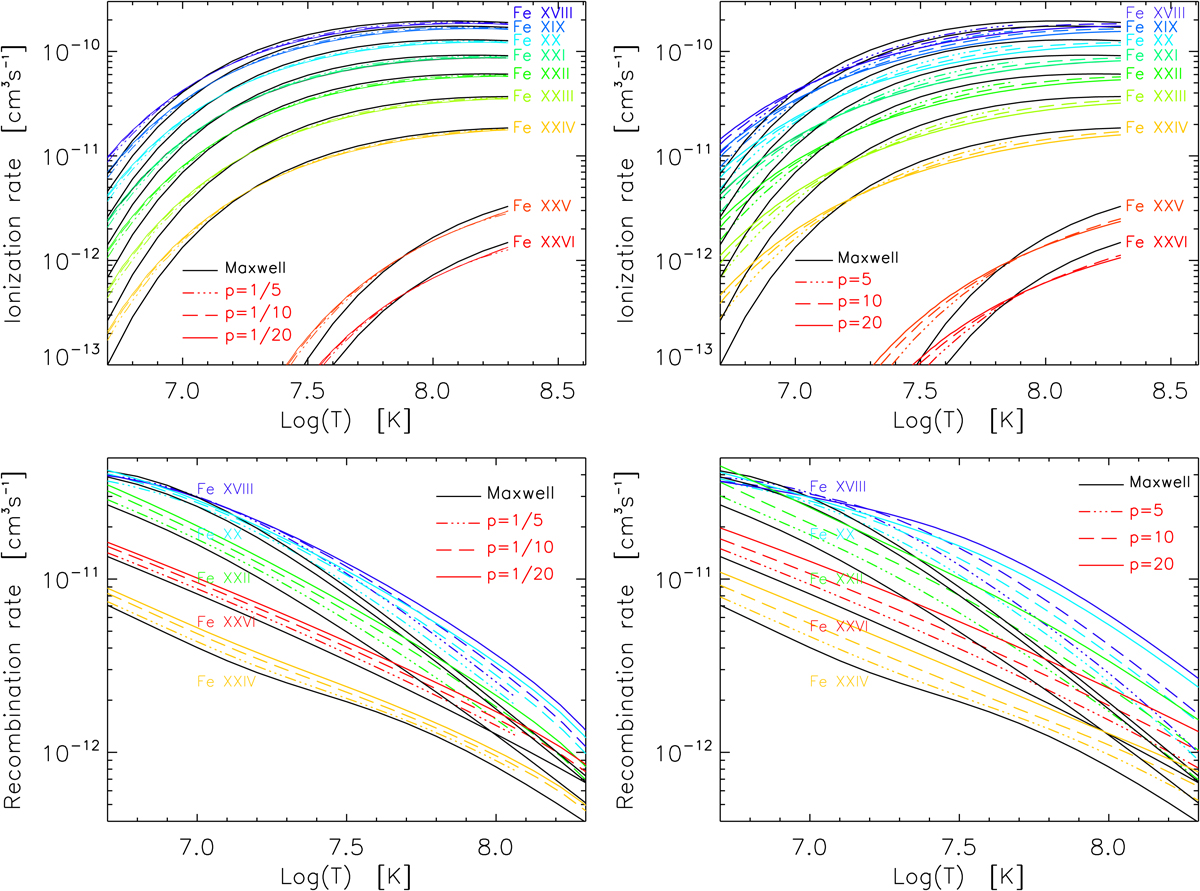
The Fe ionization (upper) and recombination rates (bottom) for the bi-Maxwellian distribution with p = 1/5 (colored dot-dot-dot-dashed lines), 1/10 (color dashed lines), and 1/20 (colored full lines), (left), and p = 5 (colored dot-dot-dot-dashed lines), 10 (colored dashed lines), and 20 (colored full lines), (right) together with Maxwellian rates (black lines). Different colors correspond to different Fe ions.
Current usage metrics show cumulative count of Article Views (full-text article views including HTML views, PDF and ePub downloads, according to the available data) and Abstracts Views on Vision4Press platform.
Data correspond to usage on the plateform after 2015. The current usage metrics is available 48-96 hours after online publication and is updated daily on week days.
Initial download of the metrics may take a while.