Fig. C.1.
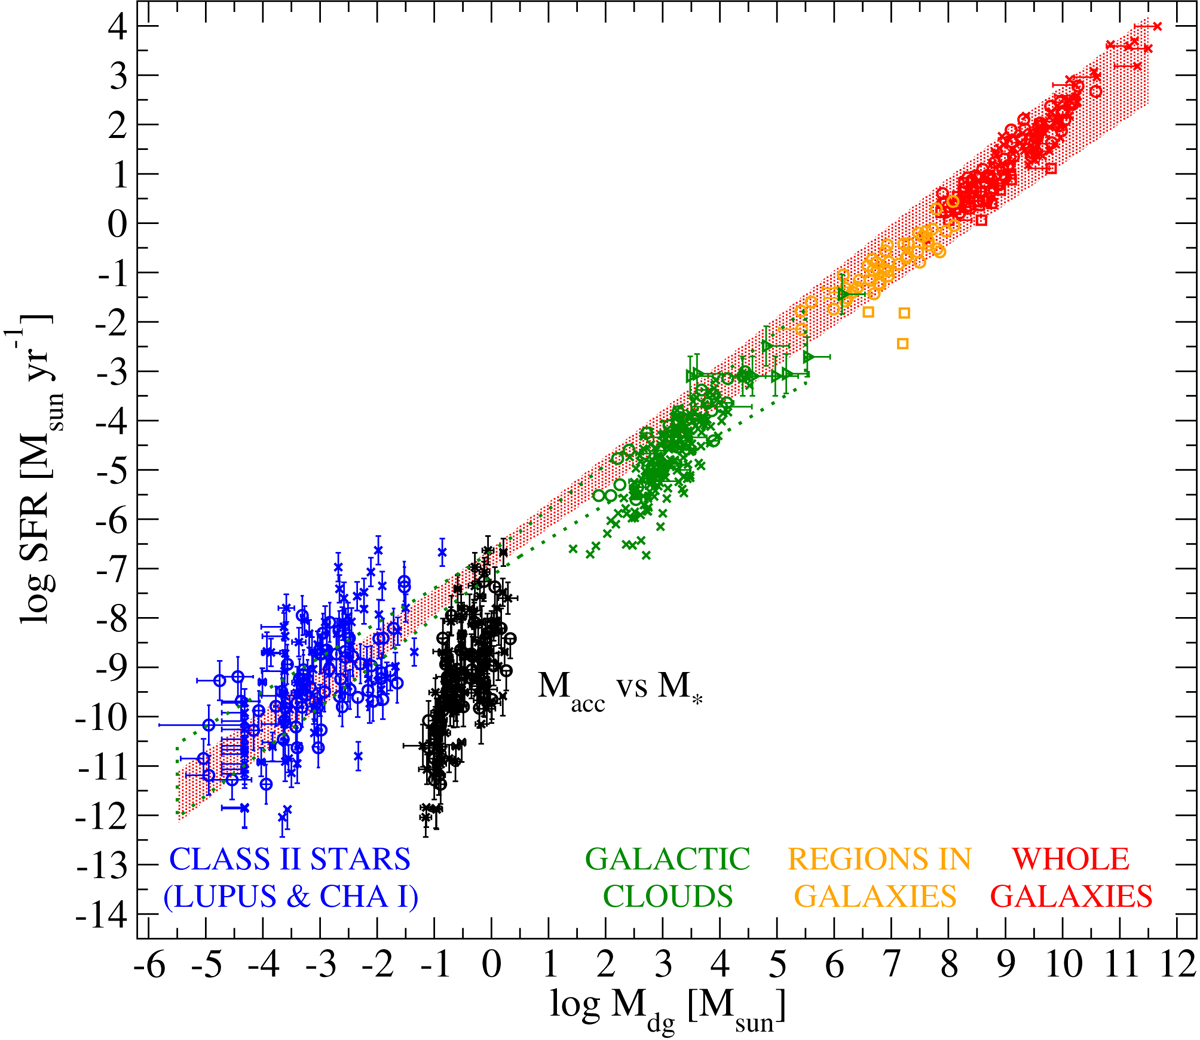
Data and linear fits shown in Fig. 2 including additional samples: Class II stars in the Cha I star-forming region (blue crosses; Mulders et al. 2017); massive Galactic clumps from the MALT90 survey (green crosses; Stephens et al. 2016); molecular clouds close to the Galactic center (green triangles; Kauffmann et al. 2017a); the central molecular zone (CMZ) in our Galaxy (orange squares; Longmore et al. 2013), regions within disks of other galaxies (orange circles; Usero et al. 2015), (U)LIRGS and star-forming galaxies (red crosses and red squares; García-Burillo et al. 2012; Usero et al. 2015). On the other hand, the accretion rates in Lupus and Cha I are plotted versus the stellar masses instead of the disk masses (black circles and crosses; Manara et al. 2016; Mulders et al. 2017).
Current usage metrics show cumulative count of Article Views (full-text article views including HTML views, PDF and ePub downloads, according to the available data) and Abstracts Views on Vision4Press platform.
Data correspond to usage on the plateform after 2015. The current usage metrics is available 48-96 hours after online publication and is updated daily on week days.
Initial download of the metrics may take a while.