Fig. 3.
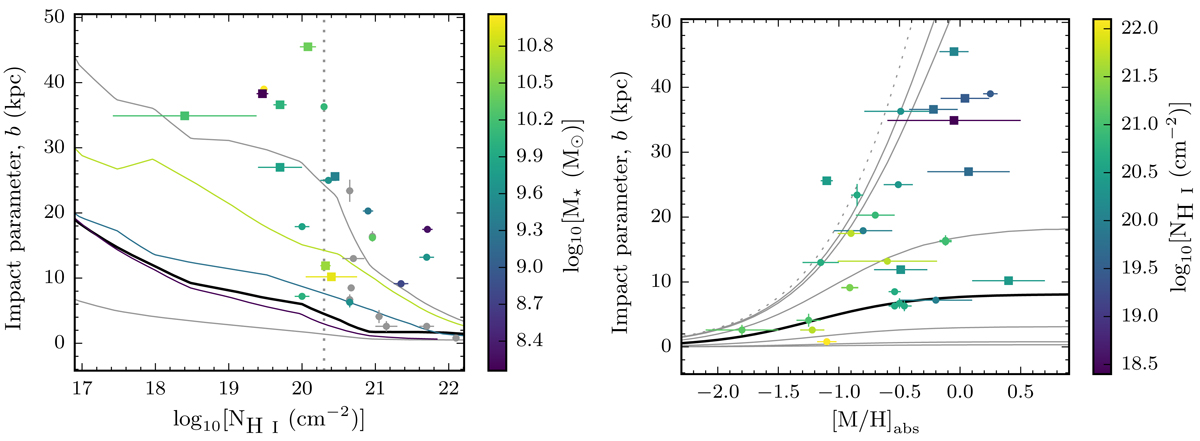
Left panel: distribution of impact parameter plotted as a function of the column density log10[NHI (cm−2)], colour-coded by stellar mass. Circles refer to data from literature. Our new identifications are plotted as squares. Grey data points represent spectroscopically confirmed absorbing galaxies without stellar mass estimates. The black line represents the median- and the grey lines represent the 1σ scatter in simulated distributions (Rahmati & Schaye 2014) at z = 2. Colour-coded lines represent the median impact parameters for those stellar mass bins, from the same simulations. Right panel: distribution of impact parameters as a function of the absorber metallicity [M/H]abs, colour-coded by column density. The black line marks the median- and the grey lines mark the 1σ, 2σ and 3σ contours based on the model-predictions from Krogager et al. (2017). The grey dotted line marks the distribution envelope.
Current usage metrics show cumulative count of Article Views (full-text article views including HTML views, PDF and ePub downloads, according to the available data) and Abstracts Views on Vision4Press platform.
Data correspond to usage on the plateform after 2015. The current usage metrics is available 48-96 hours after online publication and is updated daily on week days.
Initial download of the metrics may take a while.