Fig. 1.
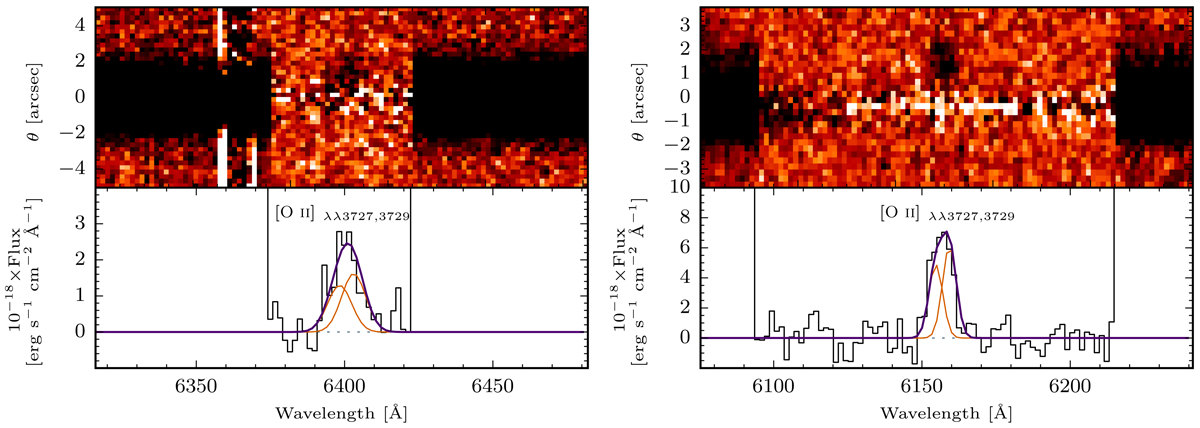
Negative colour-mapped two-dimensional VLT/FORS2 SPSF-subtracted spectra (top panels), and the extracted one-dimensional spectra (black; lower panels), centred on the [O II] λ λ 3727,3729 Å doublet. Left panel: Q 1323–0021 field shows excess emission from the DLA counterpart extending above the quasar-trace. Right panel: Q 2328+0022 reveals the presence of the DLA counterpart offset from the trace. In both panels, the fitted doublet-components are overplotted in orange, with the resulting emission profiles in purple.
Current usage metrics show cumulative count of Article Views (full-text article views including HTML views, PDF and ePub downloads, according to the available data) and Abstracts Views on Vision4Press platform.
Data correspond to usage on the plateform after 2015. The current usage metrics is available 48-96 hours after online publication and is updated daily on week days.
Initial download of the metrics may take a while.