Free Access
Fig. 4
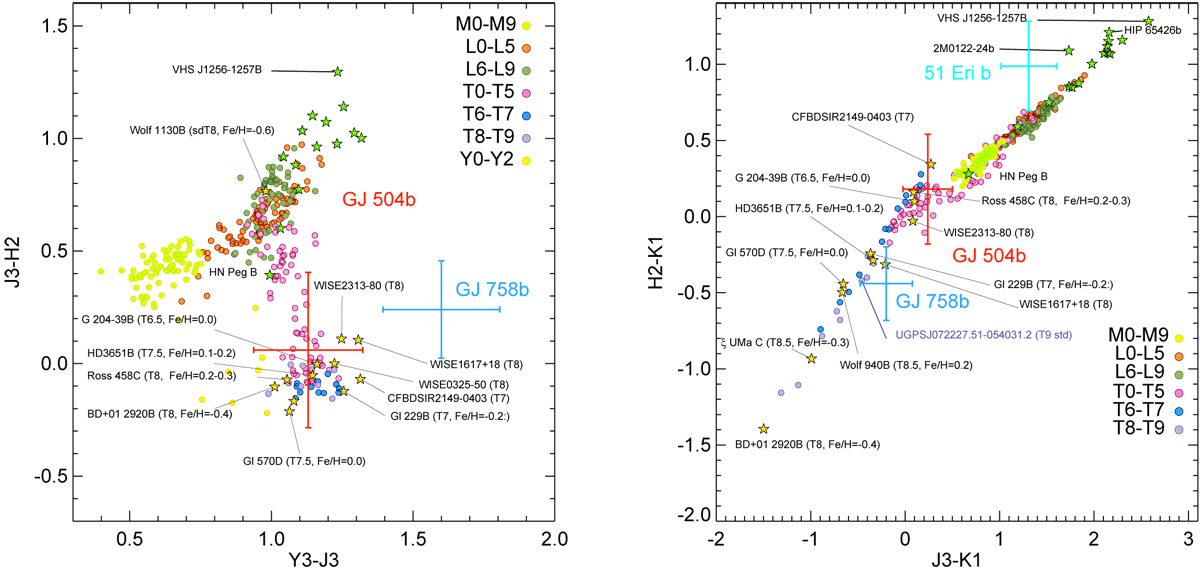
Color–color diagram using the SPHERE/IRDIS photometry. The green stars correspond to dusty and/or young dwarfs at the L/T transition. The yellow stars correspond to the benchmark T-type companions and isolated objects listed in Table A.2.
Current usage metrics show cumulative count of Article Views (full-text article views including HTML views, PDF and ePub downloads, according to the available data) and Abstracts Views on Vision4Press platform.
Data correspond to usage on the plateform after 2015. The current usage metrics is available 48-96 hours after online publication and is updated daily on week days.
Initial download of the metrics may take a while.