Fig. 20
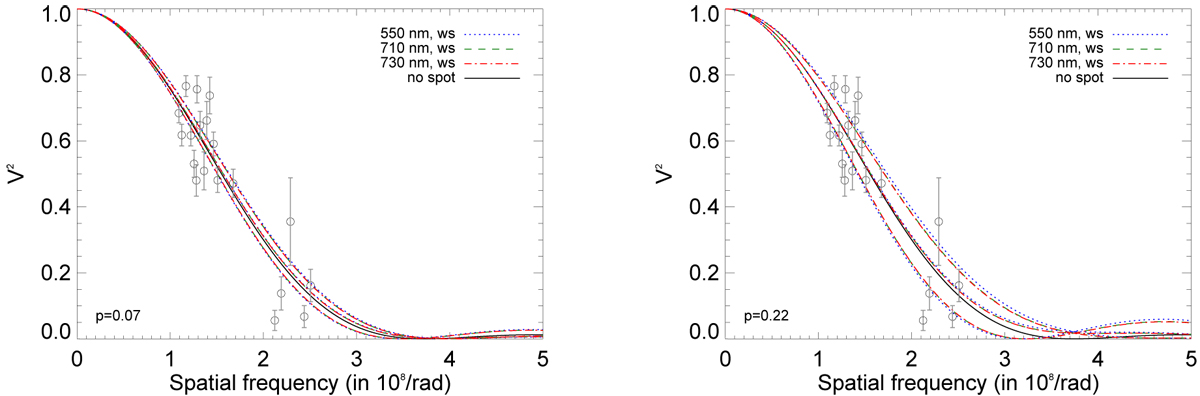
Theoretical squared visibilities of a star without a spot (solid black line), and of a star with a spot (ws) as modelised with COMETS (Ligi et al. 2015). The different solid color lines represent the squared visibilities at different wavelengths and positions. The black circles represent the actual interferometric measurements (with error bars) of GJ504 performed with VEGA/CHARA. Left panel: a spot with a filling factor p = 7%. Right panel: the same but for p = 22%.
Current usage metrics show cumulative count of Article Views (full-text article views including HTML views, PDF and ePub downloads, according to the available data) and Abstracts Views on Vision4Press platform.
Data correspond to usage on the plateform after 2015. The current usage metrics is available 48-96 hours after online publication and is updated daily on week days.
Initial download of the metrics may take a while.