Free Access
Fig. 16
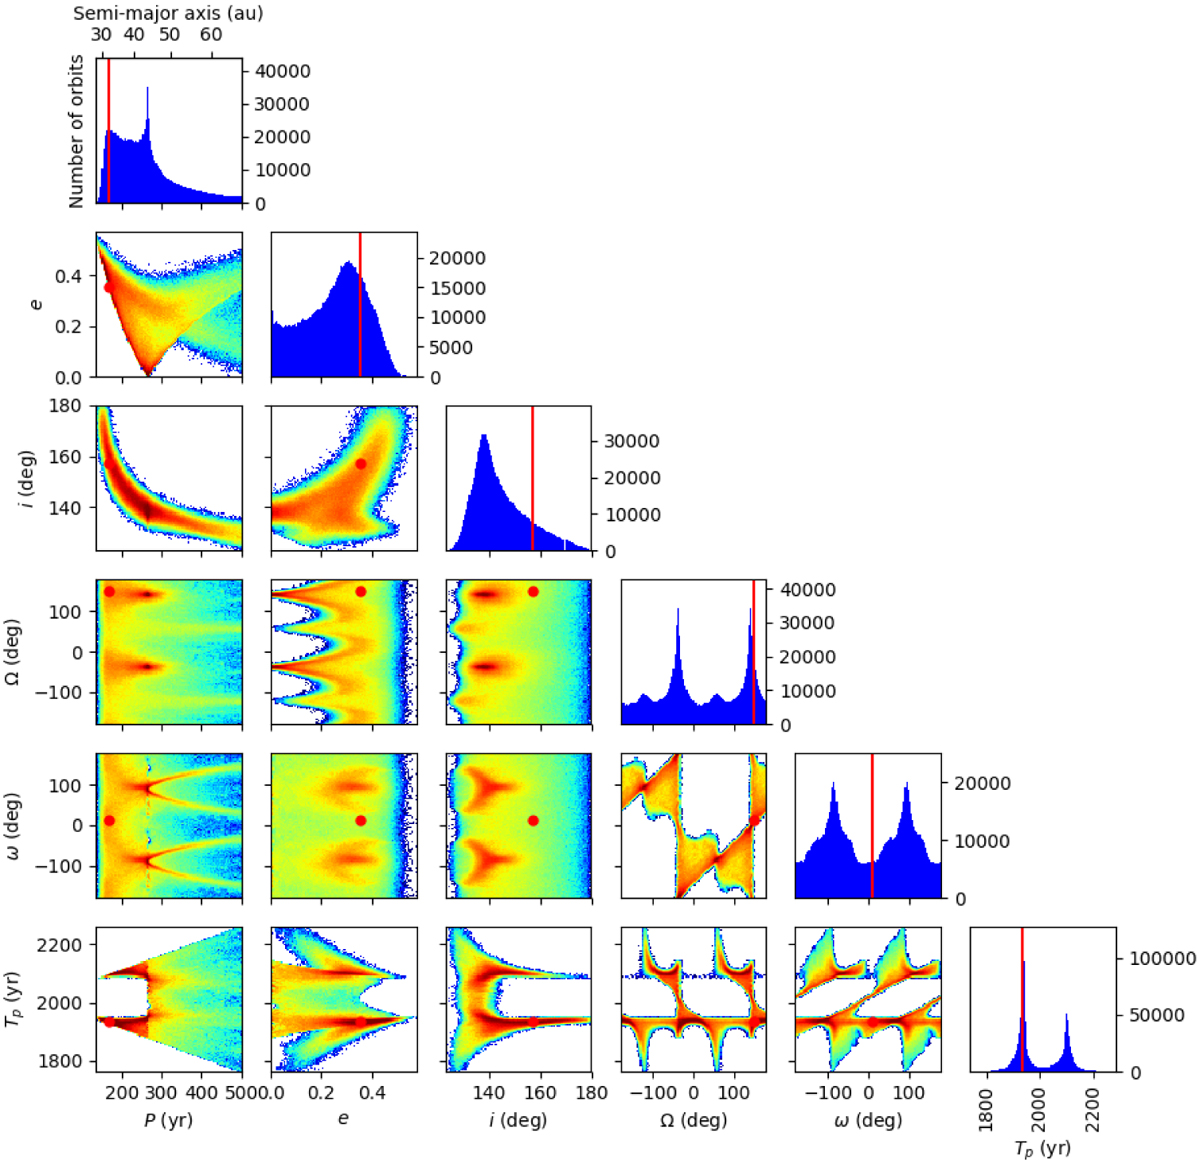
Posteriors on the orbital elements of GJ 504b when considering the astrometry from 2011 to 2017. The red lines and dots depict the best fitting orbit (better χ2). The color scale is logarithmic, blue corresponds to 1 orbit and red to 1000.
Current usage metrics show cumulative count of Article Views (full-text article views including HTML views, PDF and ePub downloads, according to the available data) and Abstracts Views on Vision4Press platform.
Data correspond to usage on the plateform after 2015. The current usage metrics is available 48-96 hours after online publication and is updated daily on week days.
Initial download of the metrics may take a while.