Fig. A.8
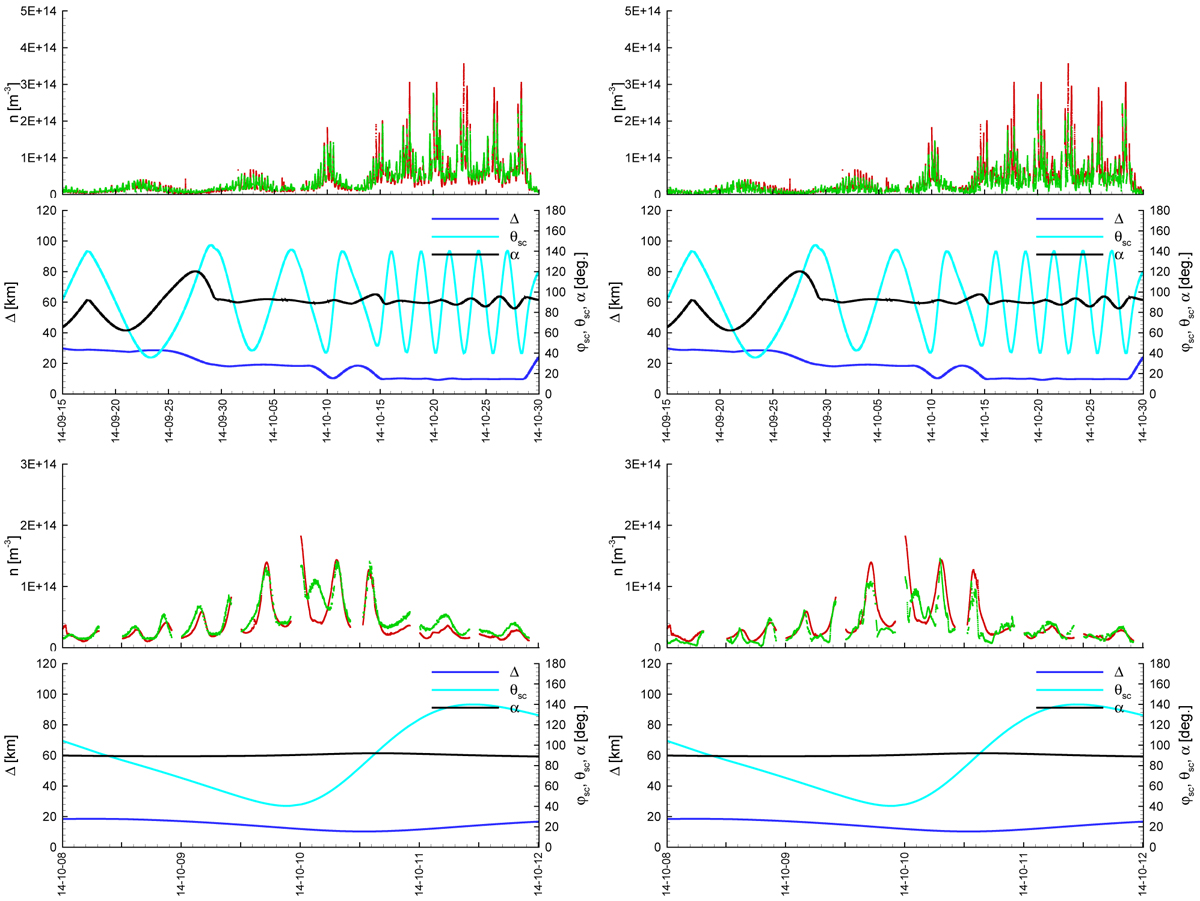
Comparison of gas density at the position of the Rosetta orbiter predicted by models with inhomogeneous (after four iterations) nucleus (green) and COPS measurements (red): in September 15–October 30, 2014 (top row), in October 8–12 (bottom row). Left panels: DSMC, right panels: EE. The bottom part of each panel shows cometocentric distance Δ, colatitude θSC, and phase angle α of the orbiter. The horizontal axis shows the date (yy-mm-dd).
Current usage metrics show cumulative count of Article Views (full-text article views including HTML views, PDF and ePub downloads, according to the available data) and Abstracts Views on Vision4Press platform.
Data correspond to usage on the plateform after 2015. The current usage metrics is available 48-96 hours after online publication and is updated daily on week days.
Initial download of the metrics may take a while.