Fig. A.7
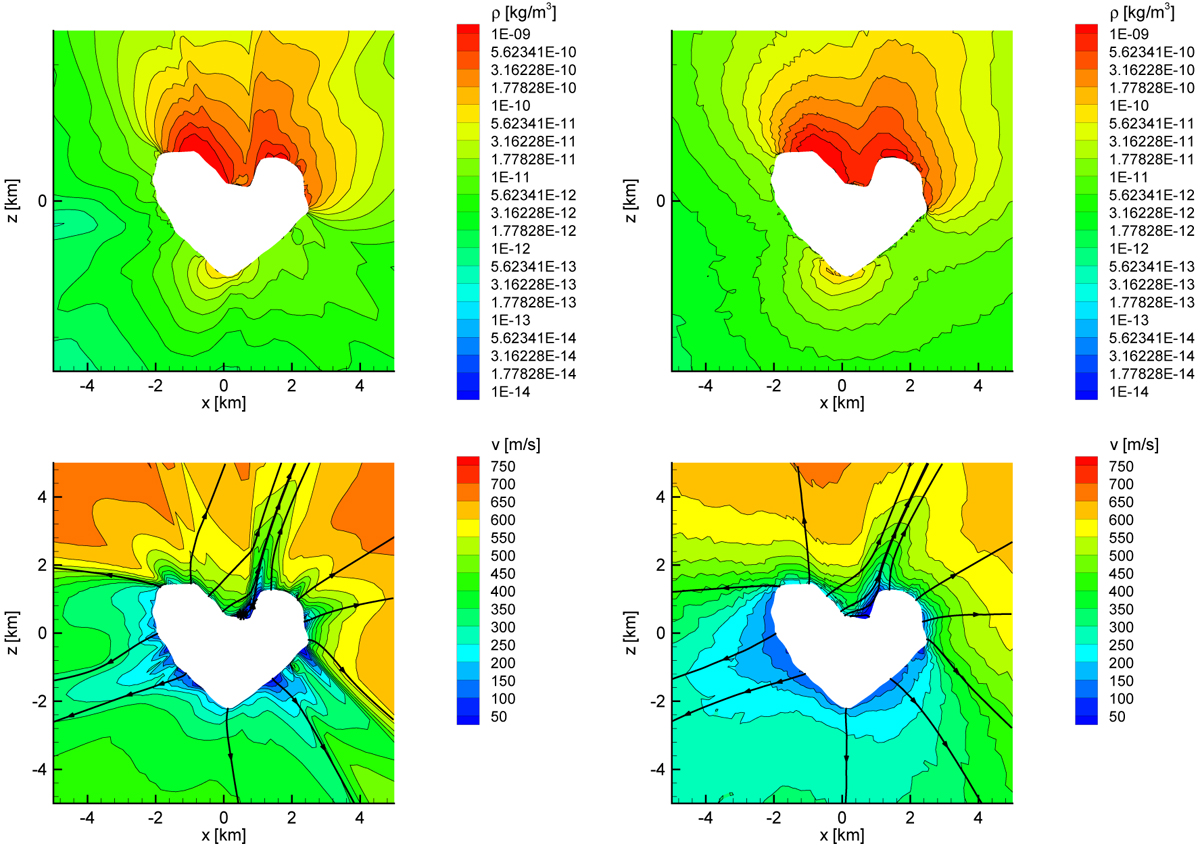
Distribution of gas density (top panels) and velocity (bottom panels) from EE (left panels) and DSMC (right panels) after adjustment. The flow streamlines are shown in black in the panels with the distribution of gas velocity. Computations were made for rh = 3.21 (October 10,2014). The Sun is in the Y = 0 plane at 40° from the +X axis in an anticlockwise direction.
Current usage metrics show cumulative count of Article Views (full-text article views including HTML views, PDF and ePub downloads, according to the available data) and Abstracts Views on Vision4Press platform.
Data correspond to usage on the plateform after 2015. The current usage metrics is available 48-96 hours after online publication and is updated daily on week days.
Initial download of the metrics may take a while.