Free Access
Fig. 8.
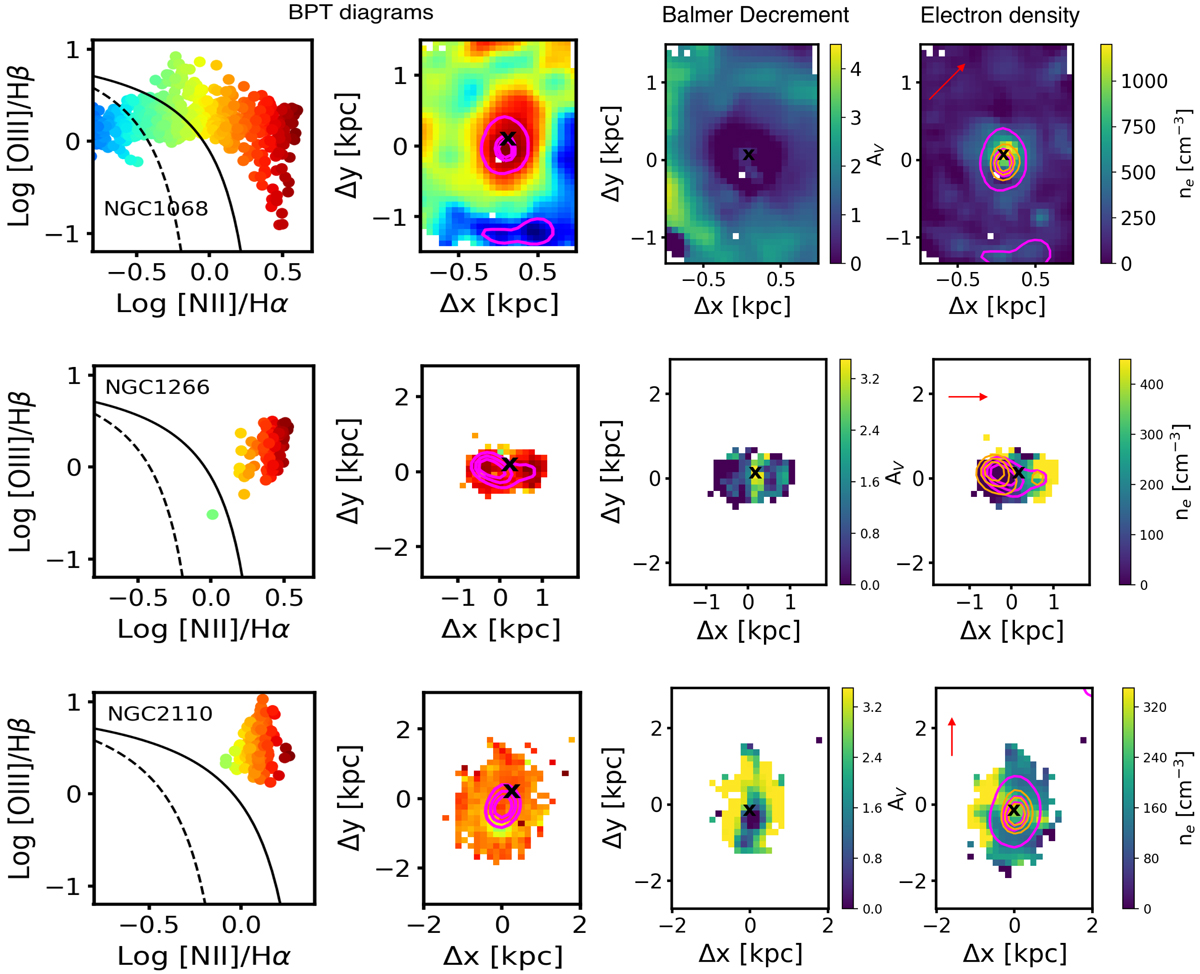
Same as Fig. 6, but for the targets showing AGN-driven outflows: (top to bottom) NGC 1068, NGC 1266, and NGC 2110. The density maps in this figure were obtained from the ratio of the total flux of the individual emission lines of the [S II] doublet, which is often used in literature.
Current usage metrics show cumulative count of Article Views (full-text article views including HTML views, PDF and ePub downloads, according to the available data) and Abstracts Views on Vision4Press platform.
Data correspond to usage on the plateform after 2015. The current usage metrics is available 48-96 hours after online publication and is updated daily on week days.
Initial download of the metrics may take a while.