Fig. 3.
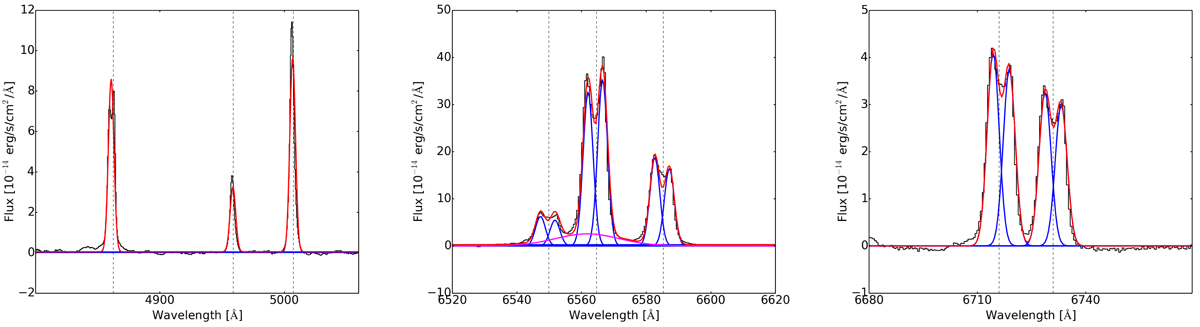
Stellar continuum subtracted integrated spectrum of NGC 1365 showing the Hβ and [O III]λ4959,5007 emission lines (left panel), [N II]λ6548,6585 and Hα (middle panel), and [S II] doublet (right panel). All the wavelengths on the x-axis are the rest frame wavelengths. The underlying black curve shows the observed spectrum and the overlaid red curve shows the overall model. The blue curves show the individual narrow Gaussian components and the magenta curve shows the broad Hα Gaussian component. The vertical dotted lines show the expected position of the Hβ,[O III], [N II], Hα, and [S II] doublet emission lines inferred from the redshift of the targets.
Current usage metrics show cumulative count of Article Views (full-text article views including HTML views, PDF and ePub downloads, according to the available data) and Abstracts Views on Vision4Press platform.
Data correspond to usage on the plateform after 2015. The current usage metrics is available 48-96 hours after online publication and is updated daily on week days.
Initial download of the metrics may take a while.