Fig. 10.
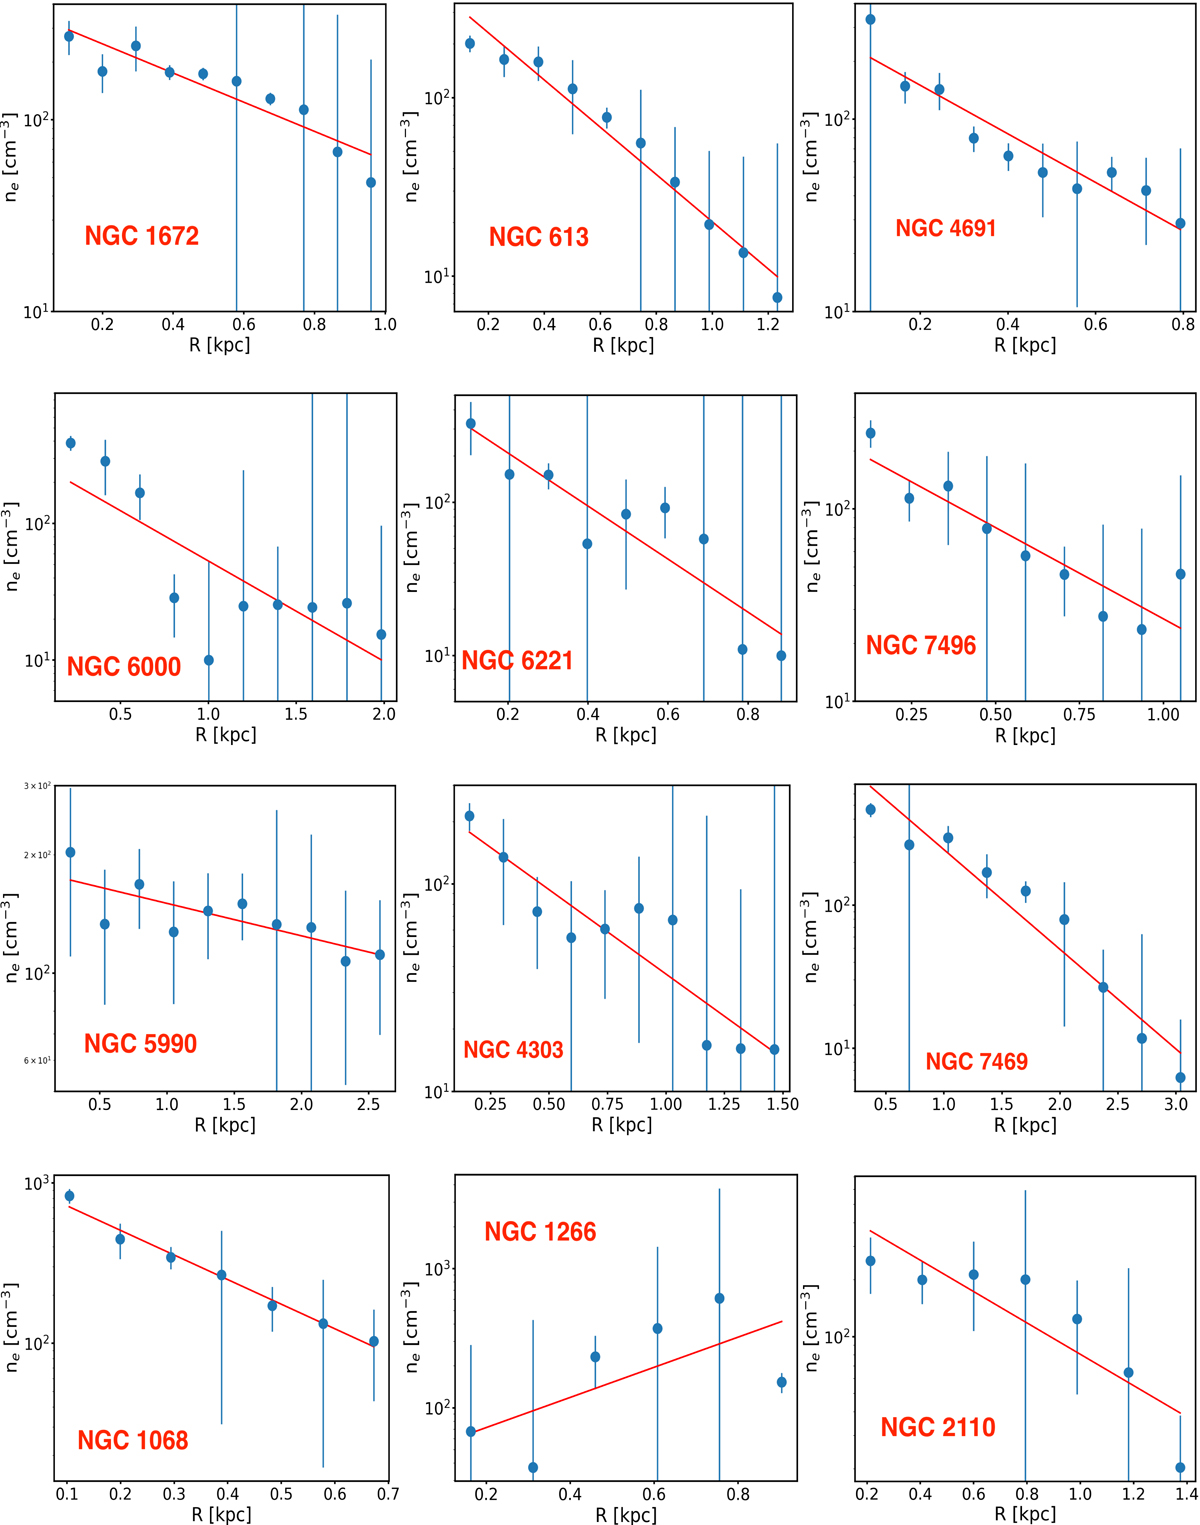
Electron density profiles of the targets presented in this paper. Blue data points show the electron density values obtained from the maps in Figs. 6 and 7, while the solid red line shows the exponential fit to the profile (see text for details). The exponential index is given in Table 2. For the targets with ionized outflows, i.e. NGC 1068, NGC 1266, and NGC 2110 (bottom panels), the density profiles were obtained for the maps presented in Fig. 8.
Current usage metrics show cumulative count of Article Views (full-text article views including HTML views, PDF and ePub downloads, according to the available data) and Abstracts Views on Vision4Press platform.
Data correspond to usage on the plateform after 2015. The current usage metrics is available 48-96 hours after online publication and is updated daily on week days.
Initial download of the metrics may take a while.