Fig. 15.
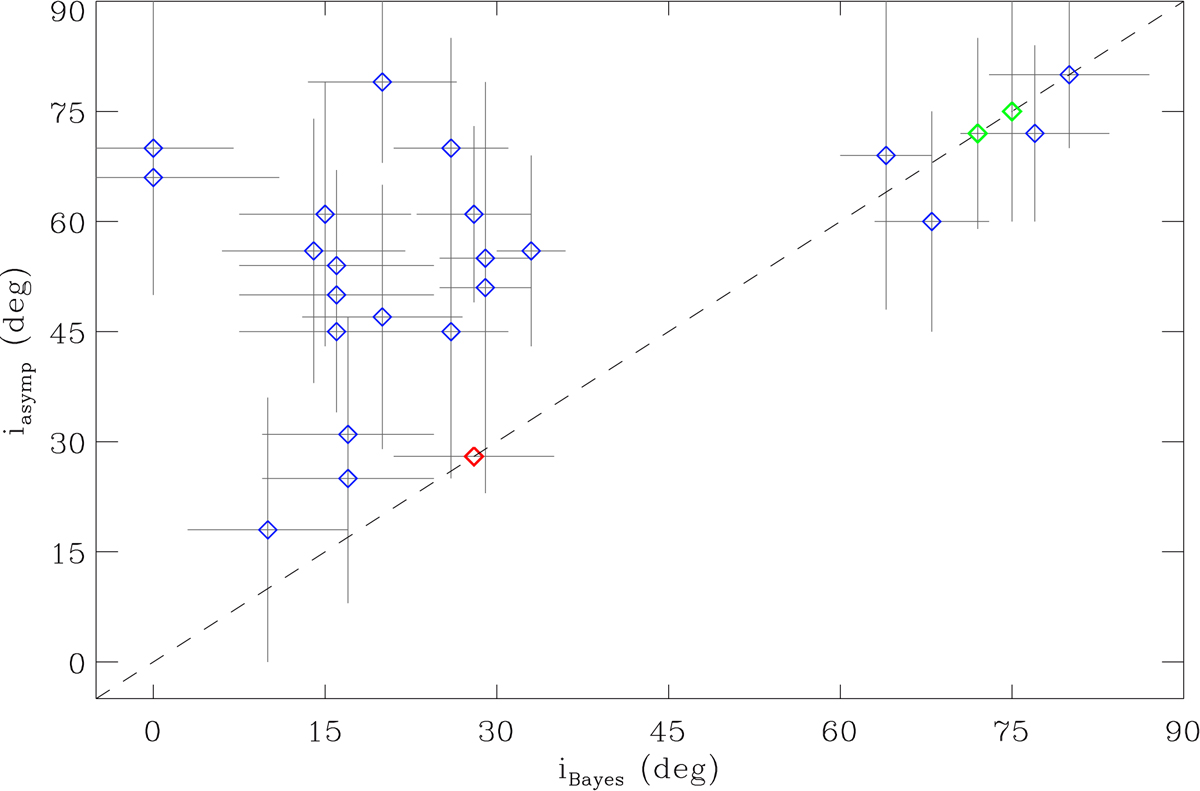
Comparison of the inclinations of the spin axis of the stars in NGC 6819. Inclinations measured by Corsaro et al. (2017) are plotted on the x-axis, while inclinations derived from the asymptotic analysis are on the y-axis; 1-σ uncertainties are indicated by vertical and horizontal error bars. The red symbol shows the case where no asymptotic fit could be found, and the green ones to cases without Bayesian fit. The dashed line corresponds to the 1:1 relation.
Current usage metrics show cumulative count of Article Views (full-text article views including HTML views, PDF and ePub downloads, according to the available data) and Abstracts Views on Vision4Press platform.
Data correspond to usage on the plateform after 2015. The current usage metrics is available 48-96 hours after online publication and is updated daily on week days.
Initial download of the metrics may take a while.