Fig. 12.
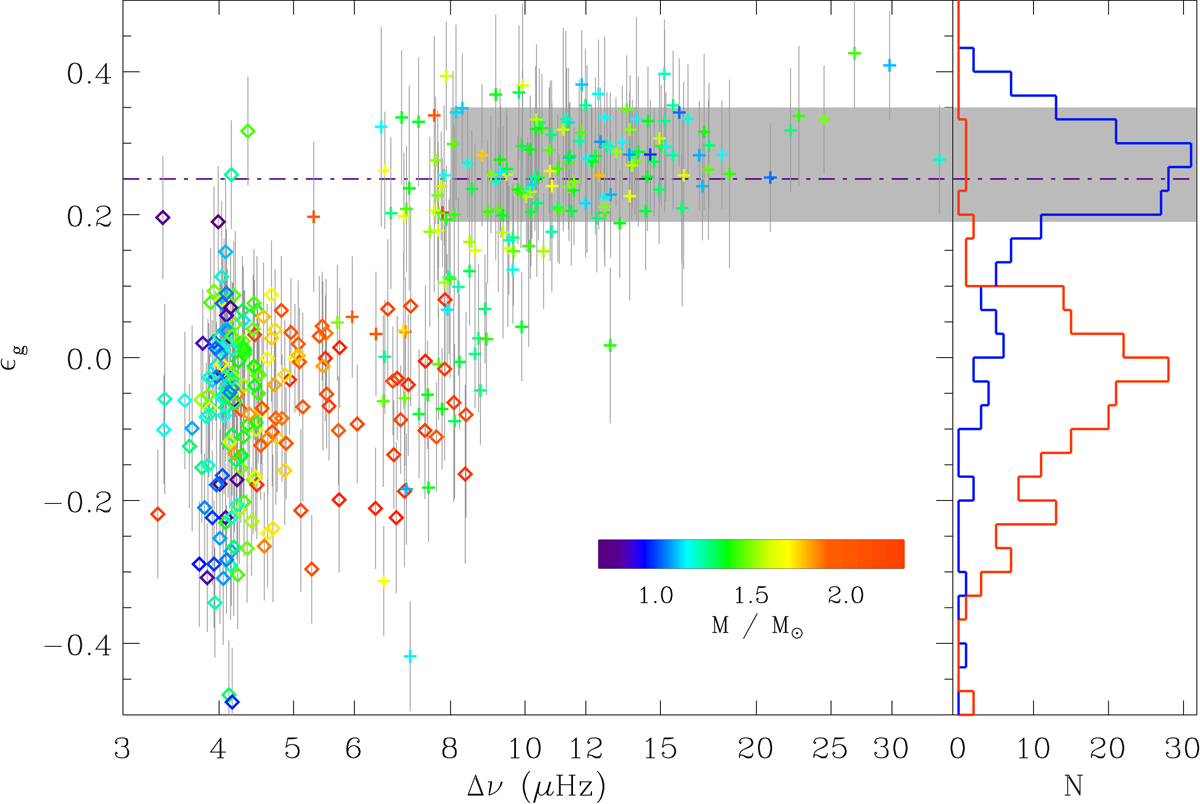
Left: variation of εg with Δν, with the same style as Fig. 11. The horizontal dark gray domain corresponds to the expected range predicted for RGB stars by Takata (2016a), whereas the dot-dashed line shows the value εg,as = 1/4 derived from the asymptotic expansion (Provost & Berthomieu 1986). Uncertainties on εg are indicated by vertical lines; uncertainties on Δν are smaller than the symbol size. Right: histograms of the distributions of εg on the RGB (blue curve) and in the red clump (red curve). The dot-dashed line and the gray domain have the same meaning as indicated above.
Current usage metrics show cumulative count of Article Views (full-text article views including HTML views, PDF and ePub downloads, according to the available data) and Abstracts Views on Vision4Press platform.
Data correspond to usage on the plateform after 2015. The current usage metrics is available 48-96 hours after online publication and is updated daily on week days.
Initial download of the metrics may take a while.