Fig. 6.
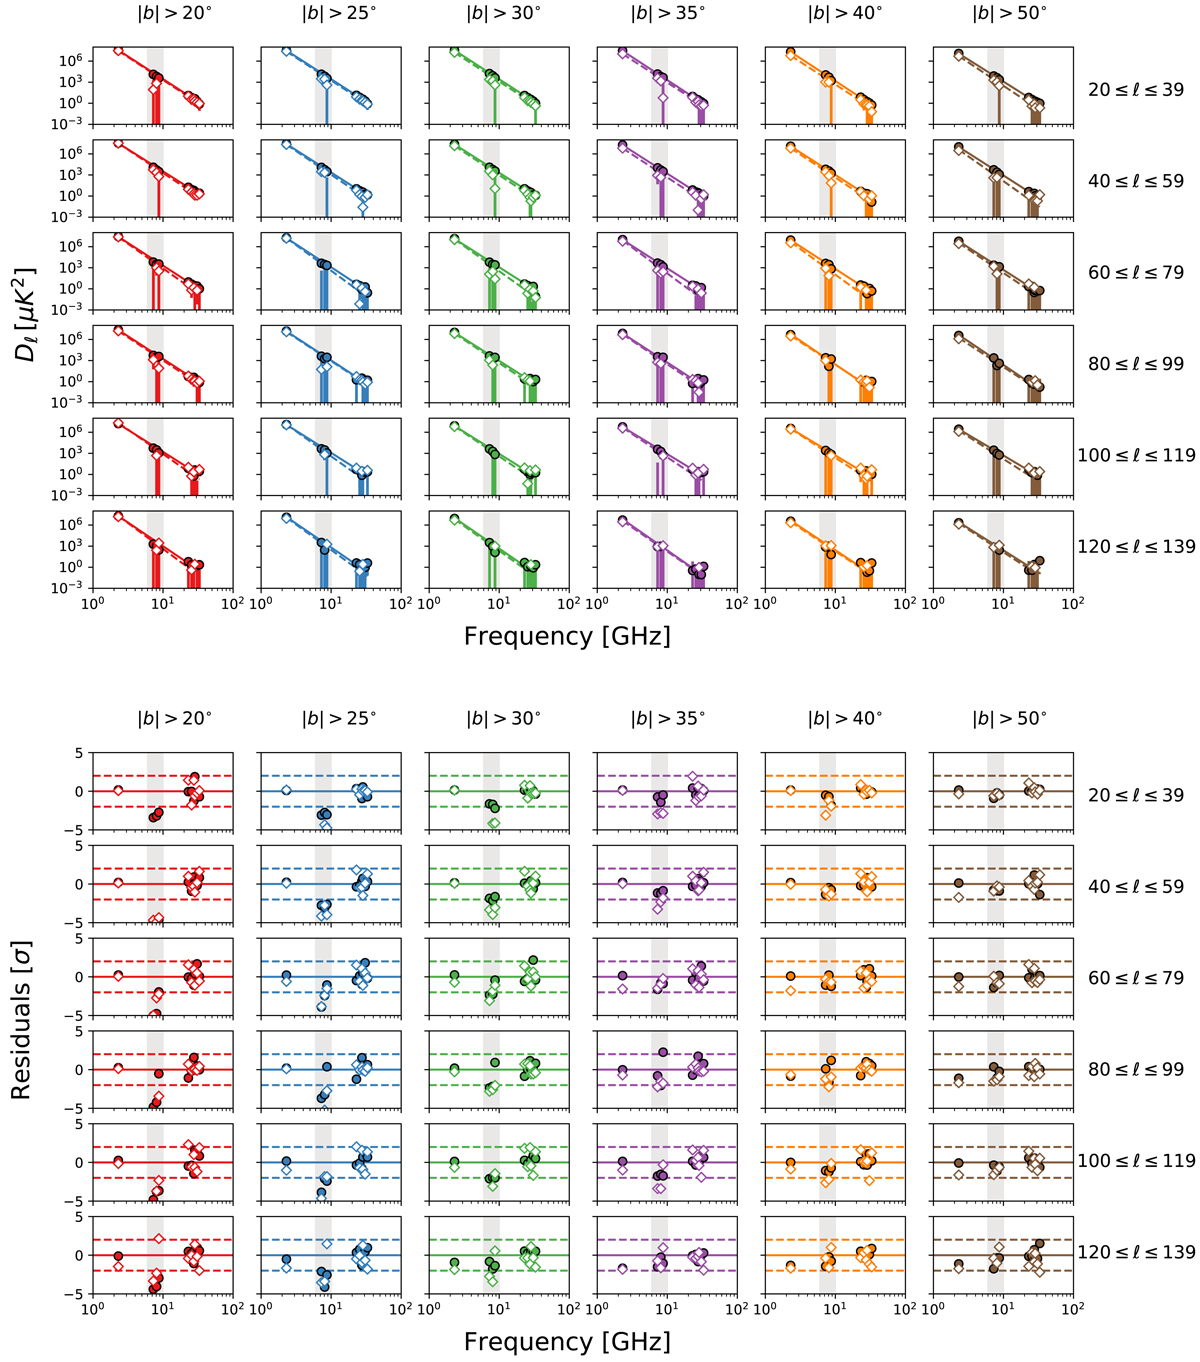
Upper panel: amplitude of computed power spectra on data for different multipole bins and sky masks (the color scheme is the same of Fig. 4) as a function of the effective frequency. Filled points refers to EE spectra, empty ones to BB. Curves represent the best model we obtain when fitting Eq. (2) to data (solid and dashed lines for E and B-modes respectively). We note that in this figure the amplitude of Dℓ = ℓ(ℓ +1)Cℓ/2π is plotted. Lower panel: residuals of the fits normalized to the 1σ error, the dashed horizontal lines represent the 2σ level. In both upper and lower panel the points inside the gray shaded area come from the correlation of S-PASS with WMAP/Planck data which, as described in the text, are not considered in the fitting.
Current usage metrics show cumulative count of Article Views (full-text article views including HTML views, PDF and ePub downloads, according to the available data) and Abstracts Views on Vision4Press platform.
Data correspond to usage on the plateform after 2015. The current usage metrics is available 48-96 hours after online publication and is updated daily on week days.
Initial download of the metrics may take a while.