Free Access
Fig. 5.
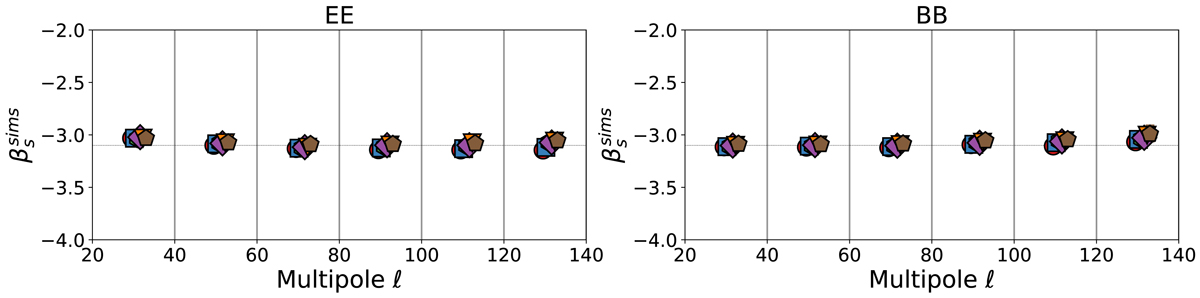
Retrieved βs parameter obtained by fitting synchrotron SED model on simulated spectra. Point colors and shapes follows the same scheme of Fig. 4. The horizontal line corresponds to βs = −3.1, which represents the input value for our set of simulations.
Current usage metrics show cumulative count of Article Views (full-text article views including HTML views, PDF and ePub downloads, according to the available data) and Abstracts Views on Vision4Press platform.
Data correspond to usage on the plateform after 2015. The current usage metrics is available 48-96 hours after online publication and is updated daily on week days.
Initial download of the metrics may take a while.