Fig. 4.
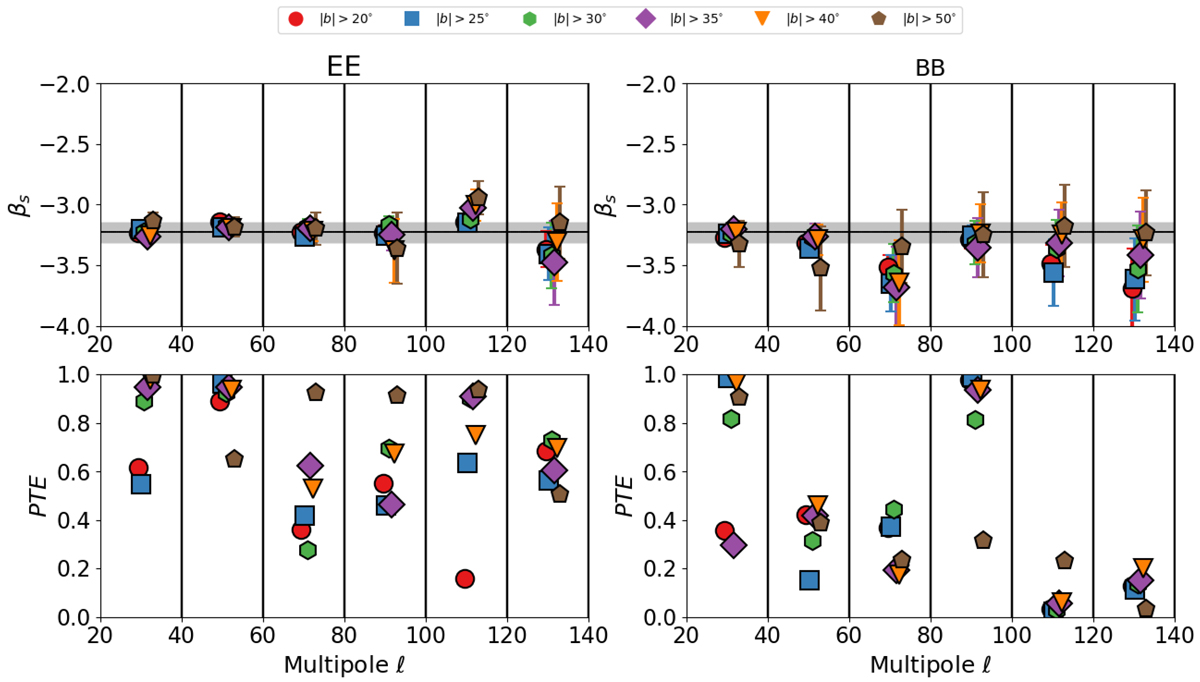
Best fit values for the synchrotron SED spectral index βs (upper panel) and PTE coefficients (lower panel), obtained by fitting the model of Eq. (2) to S-PASS, WMAP and Planck data. Different point colors and shapes refer to the different sky regions. The black line and gray area in the upper plot show the retrieved average value βs = −3.22 ± 0.08.
Current usage metrics show cumulative count of Article Views (full-text article views including HTML views, PDF and ePub downloads, according to the available data) and Abstracts Views on Vision4Press platform.
Data correspond to usage on the plateform after 2015. The current usage metrics is available 48-96 hours after online publication and is updated daily on week days.
Initial download of the metrics may take a while.