Fig. 2.
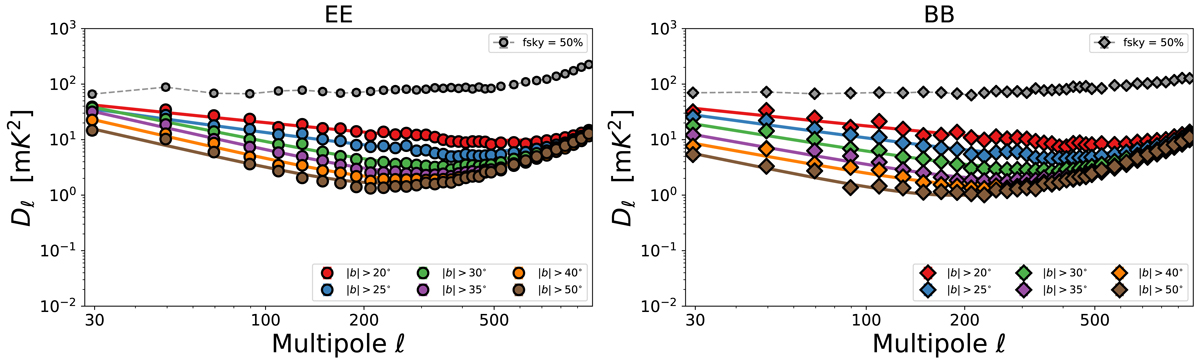
EE (left panel) and BB (right panel) power spectra of the S-PASS polarization maps computed on the set of isolatitude masks described in Sect. 2.2 (colored curves). Solid lines show the best fit curve obtained by fitting the model in Eq. (1) to the data (we note that in this figure the amplitude of Dℓ = ℓ(ℓ + 1)Cℓ/2π is plotted). Gray curves represent the polarization spectra computed on the whole sky region observed by S-PASS where the signal is strongly contaminated by the Faraday rotation effects on the Galactic plane.
Current usage metrics show cumulative count of Article Views (full-text article views including HTML views, PDF and ePub downloads, according to the available data) and Abstracts Views on Vision4Press platform.
Data correspond to usage on the plateform after 2015. The current usage metrics is available 48-96 hours after online publication and is updated daily on week days.
Initial download of the metrics may take a while.