Fig. 15.
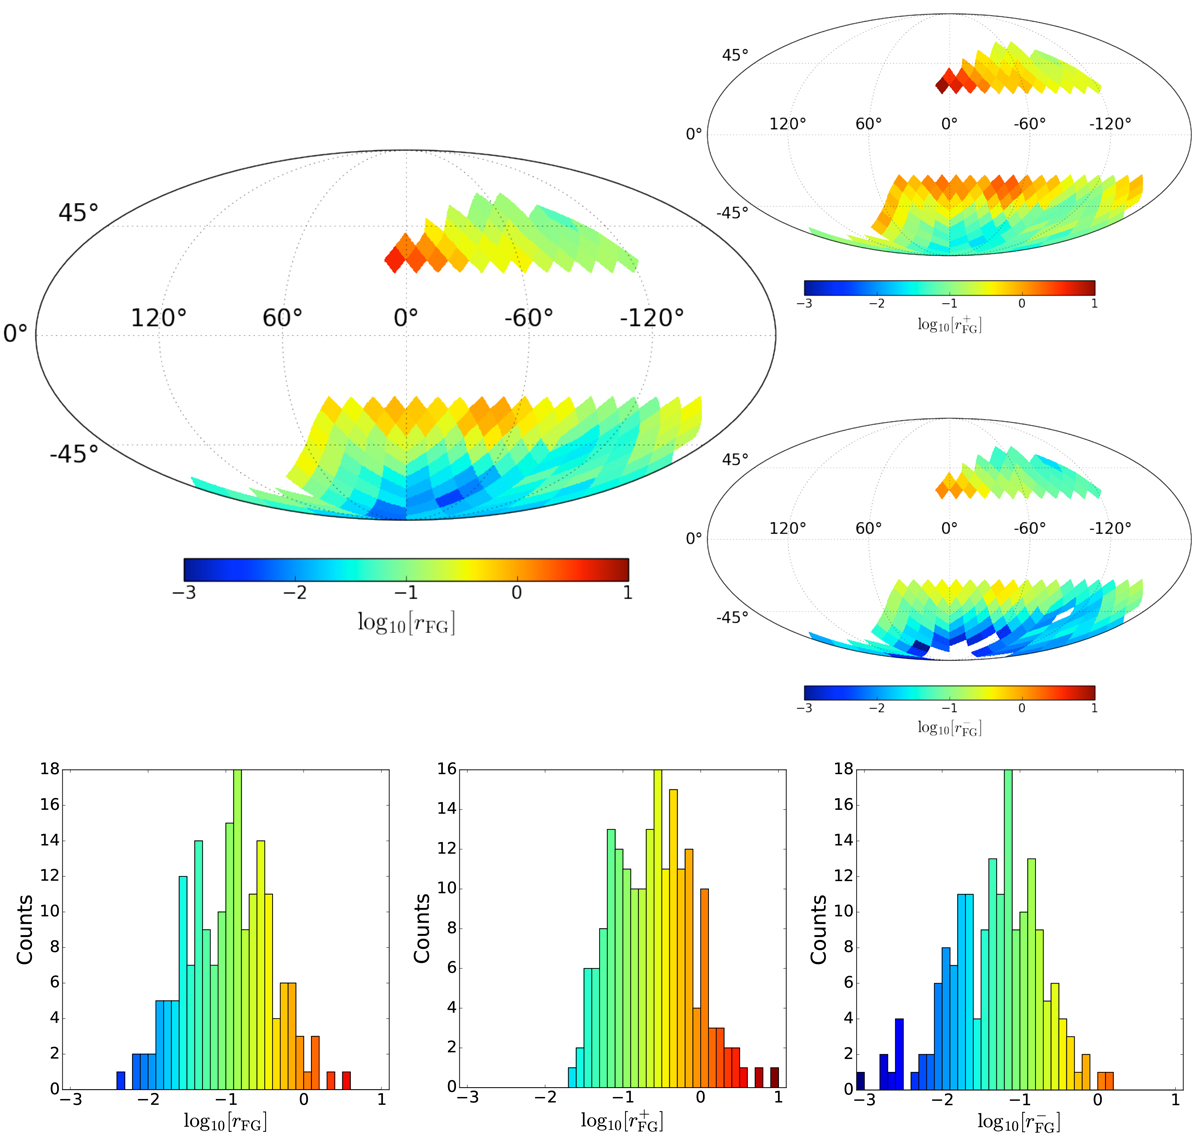
Sky distribution of the minimum foreground emission at ℓ = 80 expressed in units of the cosmological tensor-to-scalar ratio, rFG, from S-PASS and Planck-353 data. Larger and smaller maps show the mean estimated value for rFG and the 1σ lower and upper limit, ![]() and
and ![]() , respectively; the white spots close to the southern Galactic pole for
, respectively; the white spots close to the southern Galactic pole for ![]() represent locations where the latter is negative. Lower panels: histograms of the corresponding maps.
represent locations where the latter is negative. Lower panels: histograms of the corresponding maps.
Current usage metrics show cumulative count of Article Views (full-text article views including HTML views, PDF and ePub downloads, according to the available data) and Abstracts Views on Vision4Press platform.
Data correspond to usage on the plateform after 2015. The current usage metrics is available 48-96 hours after online publication and is updated daily on week days.
Initial download of the metrics may take a while.