Free Access
Fig. 13.
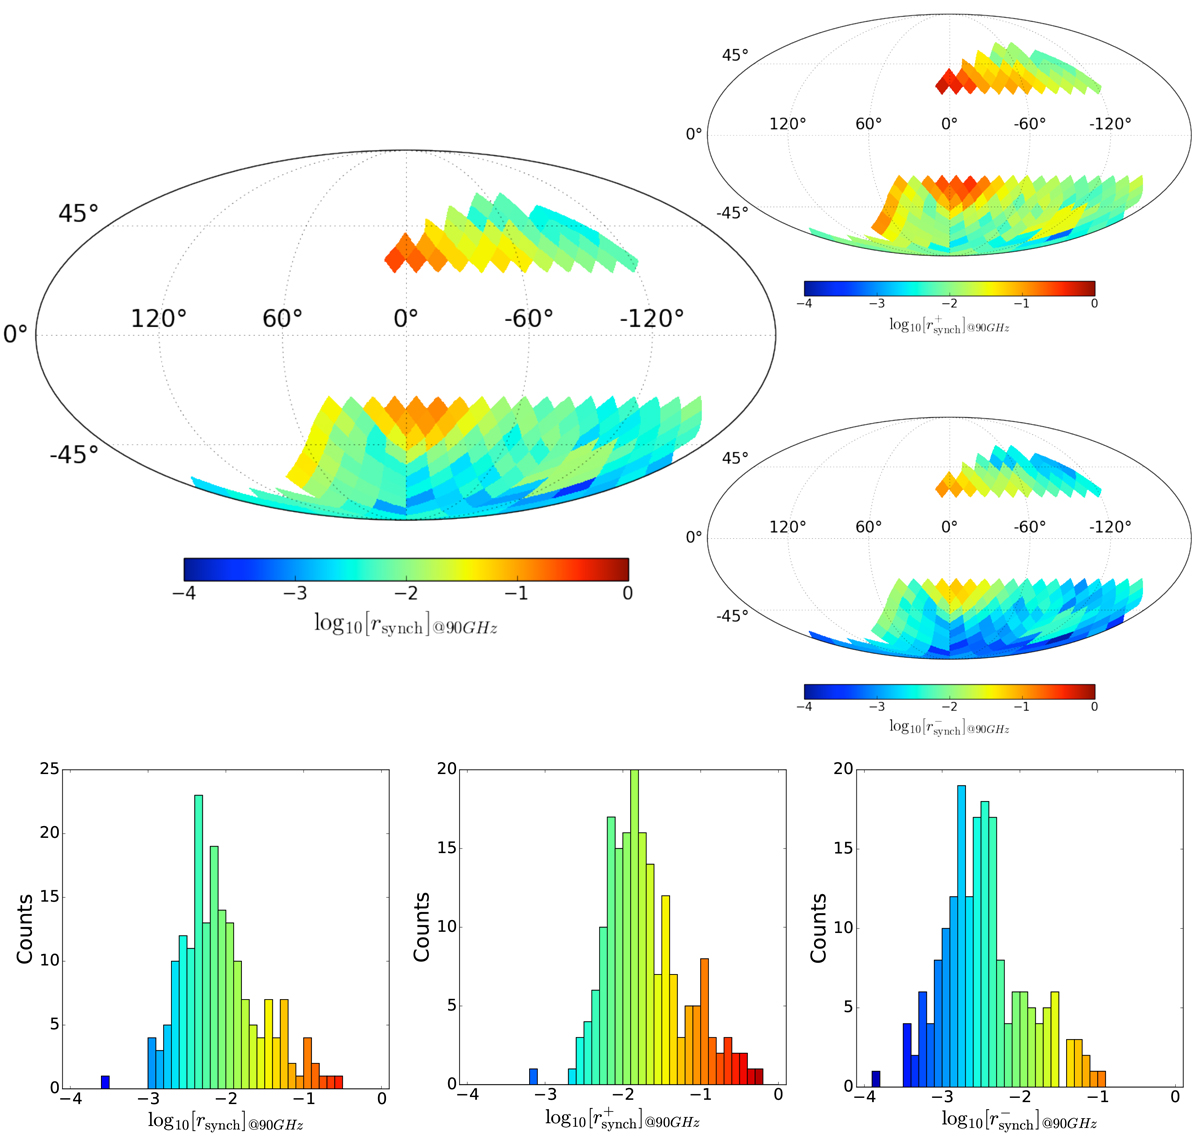
Synchrotron contamination to CMB B-modes at 90 GHz from S-PASS data, expressed in term of equivalent tensor-to-scalar ratio. In the top panels, the larger and smaller maps show the mean estimated value for rsynch and the 1σ lower and upper limit, ![]() and
and ![]() , respectively. Lower panels: histograms of the corresponding maps.
, respectively. Lower panels: histograms of the corresponding maps.
Current usage metrics show cumulative count of Article Views (full-text article views including HTML views, PDF and ePub downloads, according to the available data) and Abstracts Views on Vision4Press platform.
Data correspond to usage on the plateform after 2015. The current usage metrics is available 48-96 hours after online publication and is updated daily on week days.
Initial download of the metrics may take a while.