Fig. 7.
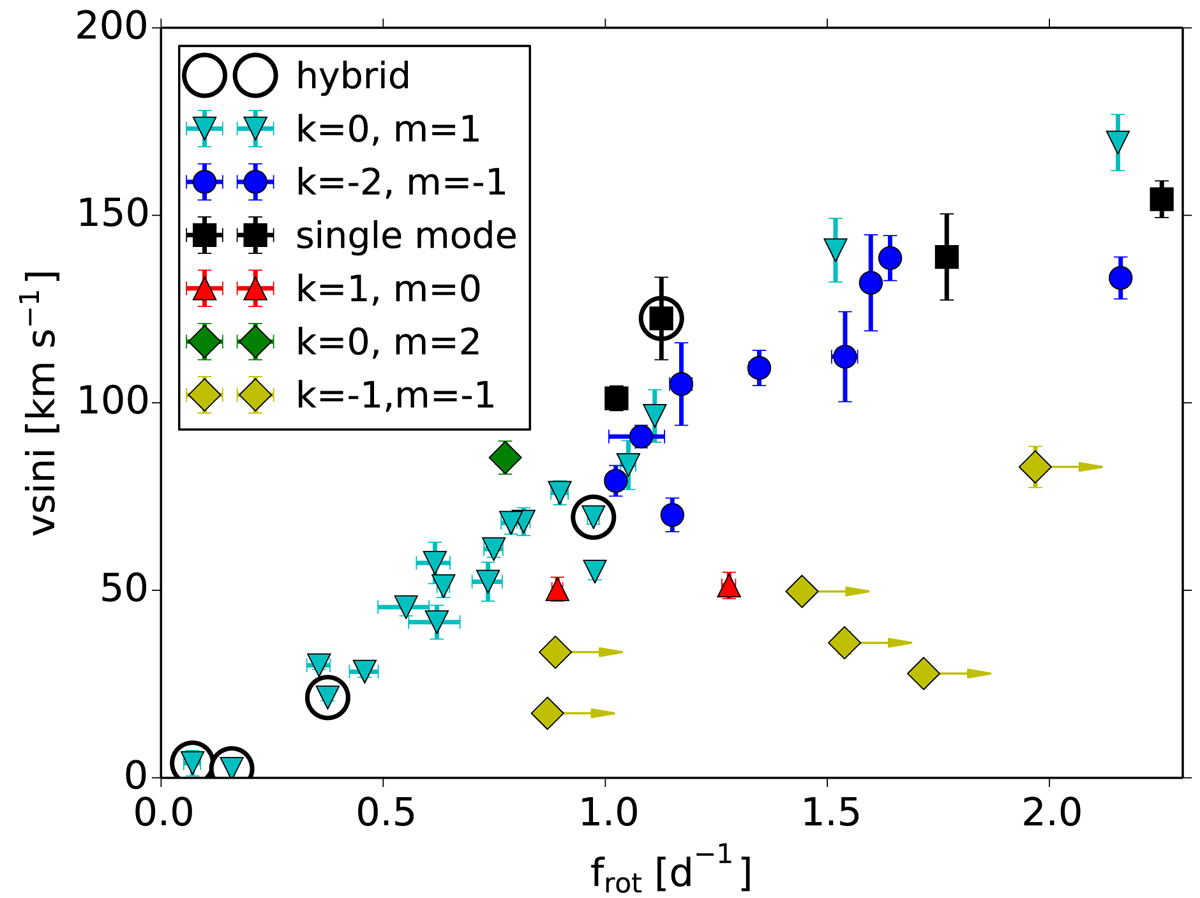
Spectroscopic rotation velocities of the single stars in our sample, as a function of the derived near-core rotation rate, assuming uniform rotation as the statistically favoured model. The symbol and colour indicate the derived pulsation mode identification. Contrary to the other stars in this figure, the stars with Yanai modes (with (k, m)=(−1, −1)) have not been successfully modelled. For these stars, the plotted rotation frequency is a lower limit, assuming the proposed mode identification is correct. The arrows indicate how the graph changes when frot is higher. This figure is an update of Fig. 14 by Van Reeth et al. (2016).
Current usage metrics show cumulative count of Article Views (full-text article views including HTML views, PDF and ePub downloads, according to the available data) and Abstracts Views on Vision4Press platform.
Data correspond to usage on the plateform after 2015. The current usage metrics is available 48-96 hours after online publication and is updated daily on week days.
Initial download of the metrics may take a while.