Fig. 10.
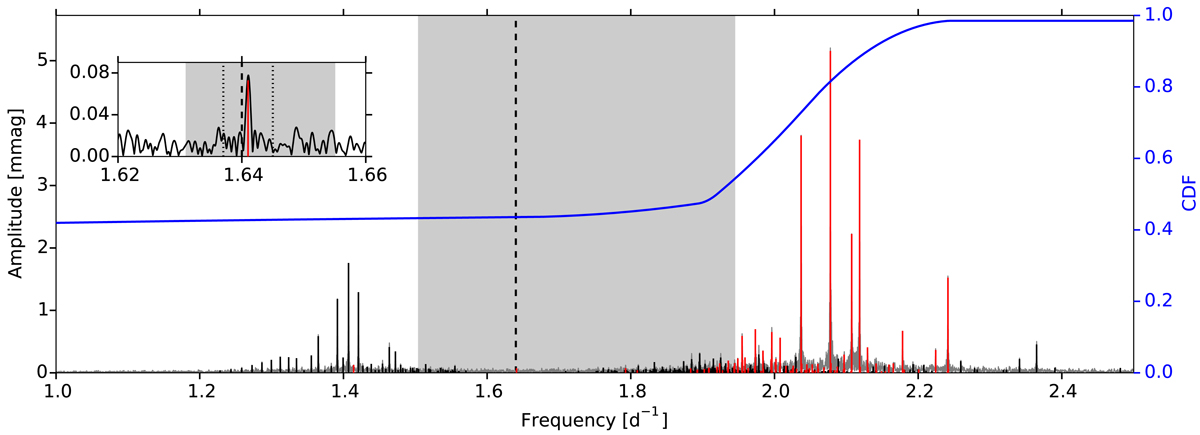
Fourier spectrum of KIC 8375138. Frequencies that fulfil our detection criterion, are indicated in black, whereas frequencies marked in red fulfil the detection criterion, and have the first-order harmonic within the extracted frequency list. The derived near-core rotation frequency and its harmonic are indicated with the dashed and dotted lines, respectively, while the cumulative distribution function of the red frequency peaks is shown by the blue curve. Signatures of rotational modulation occur within the shaded grey frequency range. Inset: a close-up of the Fourier spectrum around the near-core rotation rate frot,i (dashed line). The 1σ (dotted lines) and 3σ (grey area) uncertainties on frot,i are indicated. The ten highest-amplitude pulsation frequencies have been prewhitened for clarity.
Current usage metrics show cumulative count of Article Views (full-text article views including HTML views, PDF and ePub downloads, according to the available data) and Abstracts Views on Vision4Press platform.
Data correspond to usage on the plateform after 2015. The current usage metrics is available 48-96 hours after online publication and is updated daily on week days.
Initial download of the metrics may take a while.