Fig. 9
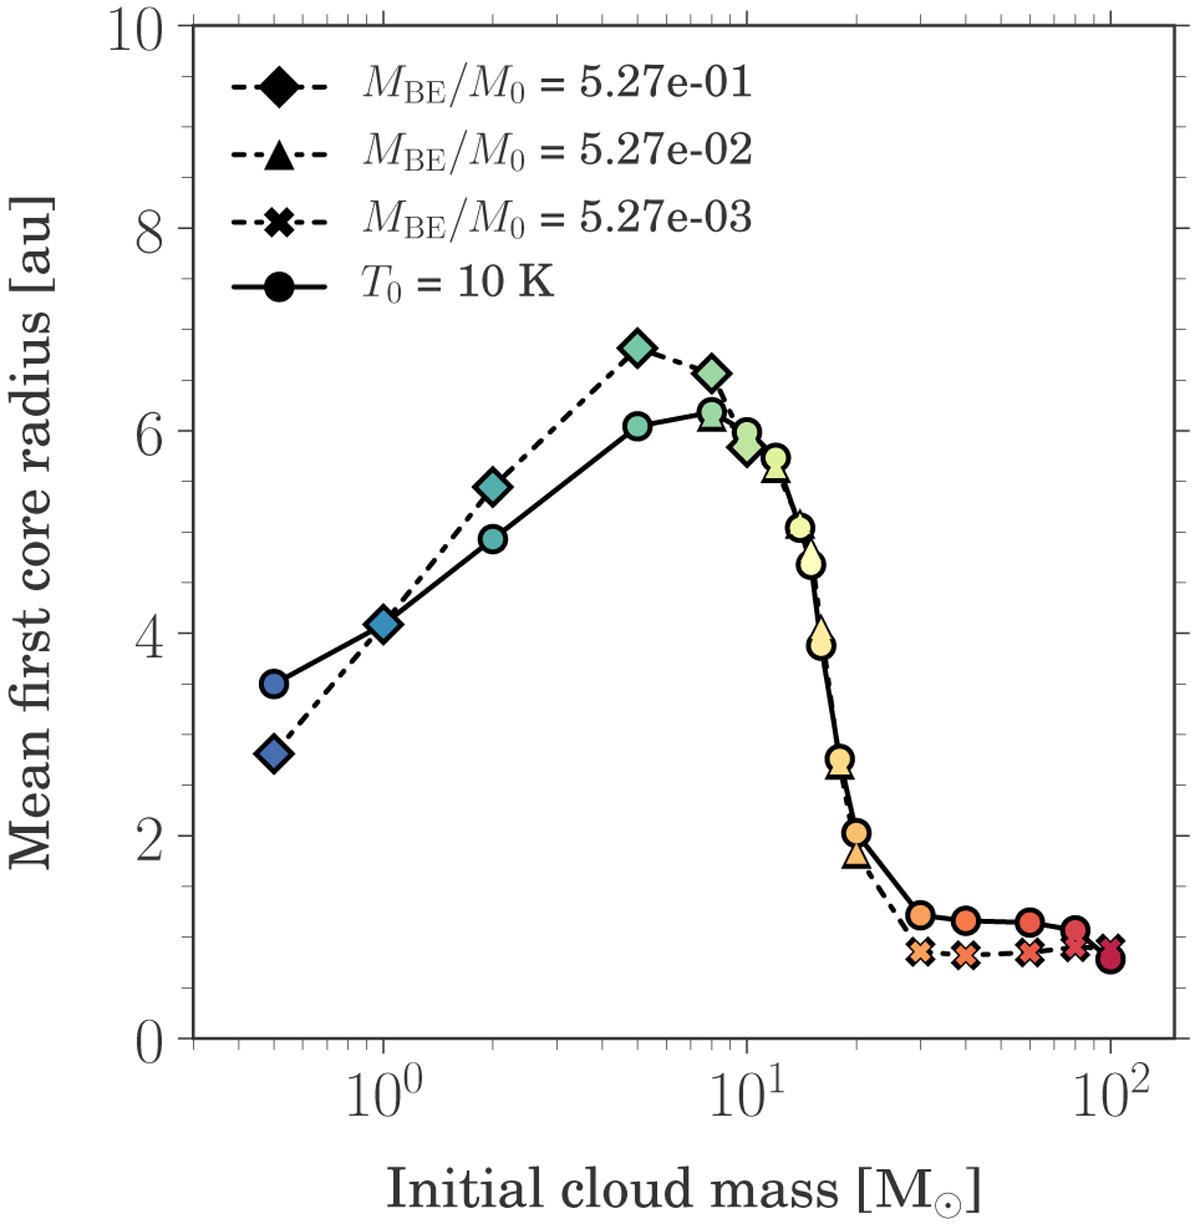
Mean first core radius as a function of initial cloud mass. The mean radius is calculated over the time from the onset of the first core formation until the second core formation. The circles indicate results from the simulation runs with a constant initial temperature of 10 K, whereas the diamonds, triangles, and crosses indicate results from the simulation runs with constant stability parameters MBE ∕M0 of 5.27e-01, 5.27e-02, and 5.27e-03 for the low-, intermediate-, and high-mass regimes, respectively.
Current usage metrics show cumulative count of Article Views (full-text article views including HTML views, PDF and ePub downloads, according to the available data) and Abstracts Views on Vision4Press platform.
Data correspond to usage on the plateform after 2015. The current usage metrics is available 48-96 hours after online publication and is updated daily on week days.
Initial download of the metrics may take a while.