Free Access
Fig. 6
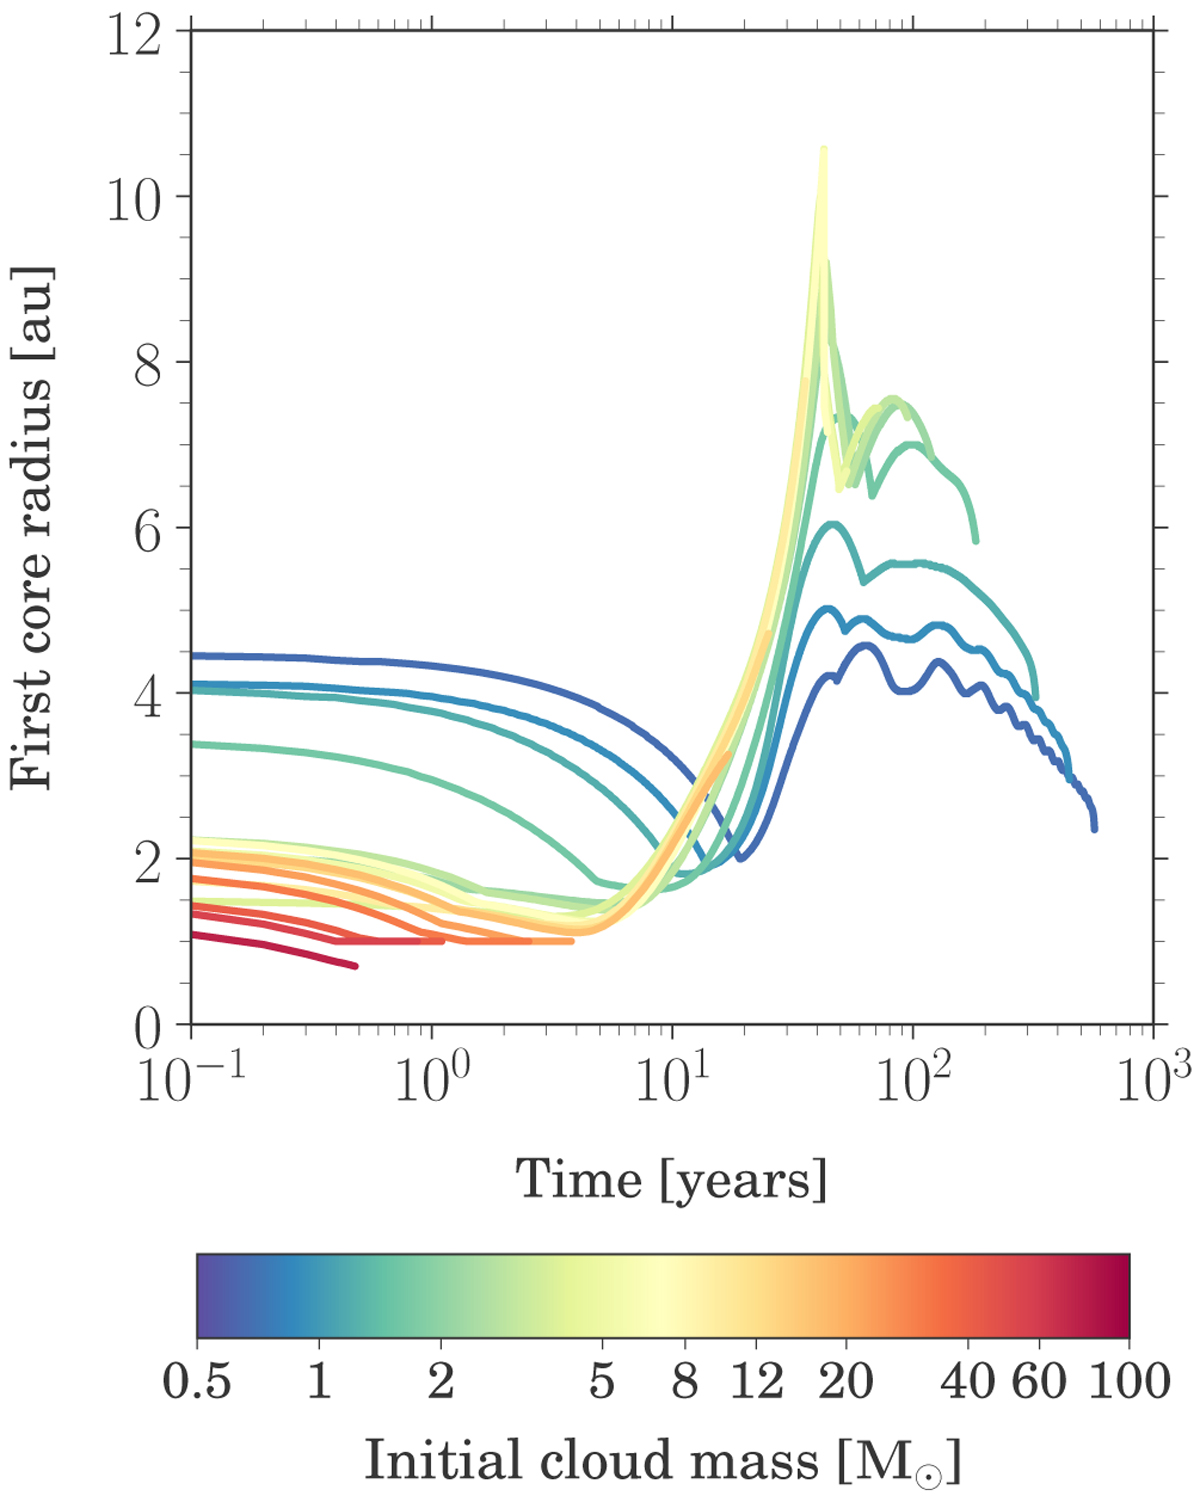
Time evolution of the first core radius showing an initial contraction phase followed by a rapid expansion and a second contraction phase. The colours indicate the different initial cloud masses ranging from 0.5 to 100 M⊙ as shown in the colour bar.
Current usage metrics show cumulative count of Article Views (full-text article views including HTML views, PDF and ePub downloads, according to the available data) and Abstracts Views on Vision4Press platform.
Data correspond to usage on the plateform after 2015. The current usage metrics is available 48-96 hours after online publication and is updated daily on week days.
Initial download of the metrics may take a while.