Fig. 4
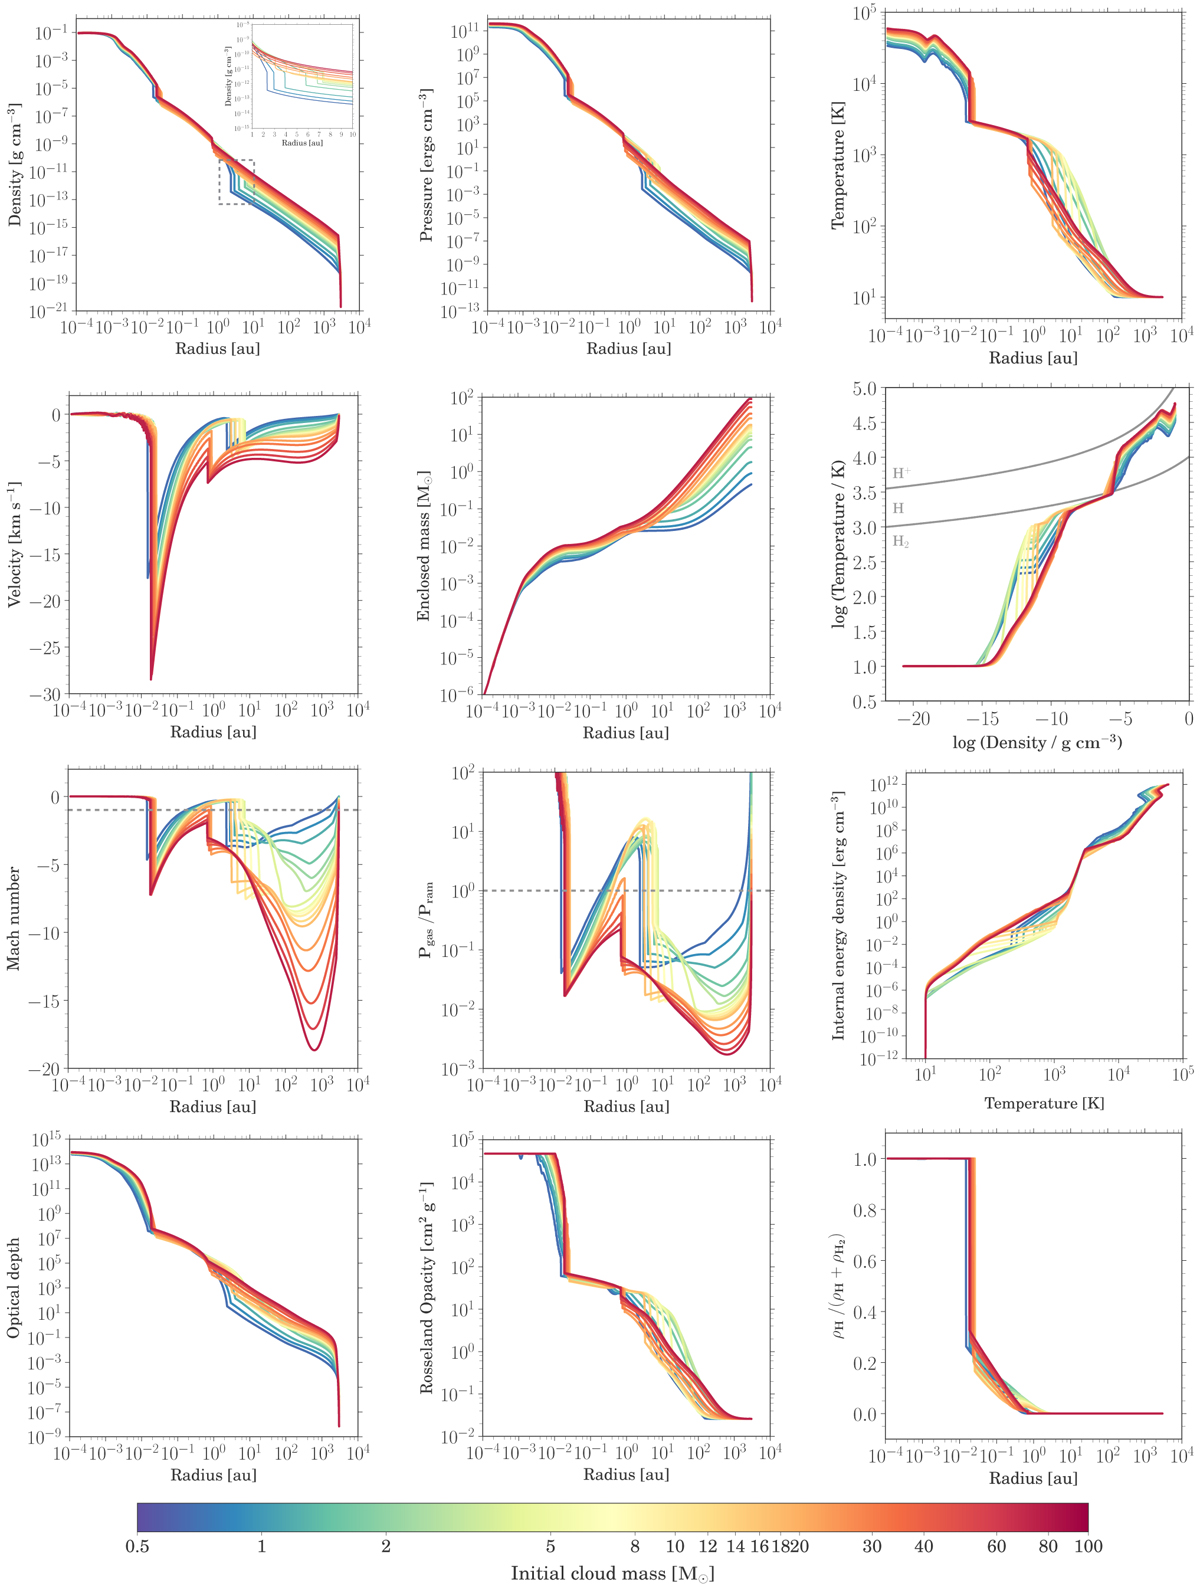
Shown above are the radial profiles (across and down) of density (panel a), pressure (panel b), gas temperature (panel c), velocity (panel d), and enclosed mass (panel e) as well as the thermal structure (panel f), Mach number (panel g), ratio of gas to ram pressure (panel h), internal energy density as a function of temperature (panel i), optical depth (panel j), Rosseland mean opacity (panel k), and dissociation fraction at the snapshot after second core formation (panel l). Different colours indicate clouds with different initial masses as seen in the colour bar. The grey lines in the thermal structure plot show the 50% dissociation and ionization curves according to Eqs. (16) and (17).
Current usage metrics show cumulative count of Article Views (full-text article views including HTML views, PDF and ePub downloads, according to the available data) and Abstracts Views on Vision4Press platform.
Data correspond to usage on the plateform after 2015. The current usage metrics is available 48-96 hours after online publication and is updated daily on week days.
Initial download of the metrics may take a while.