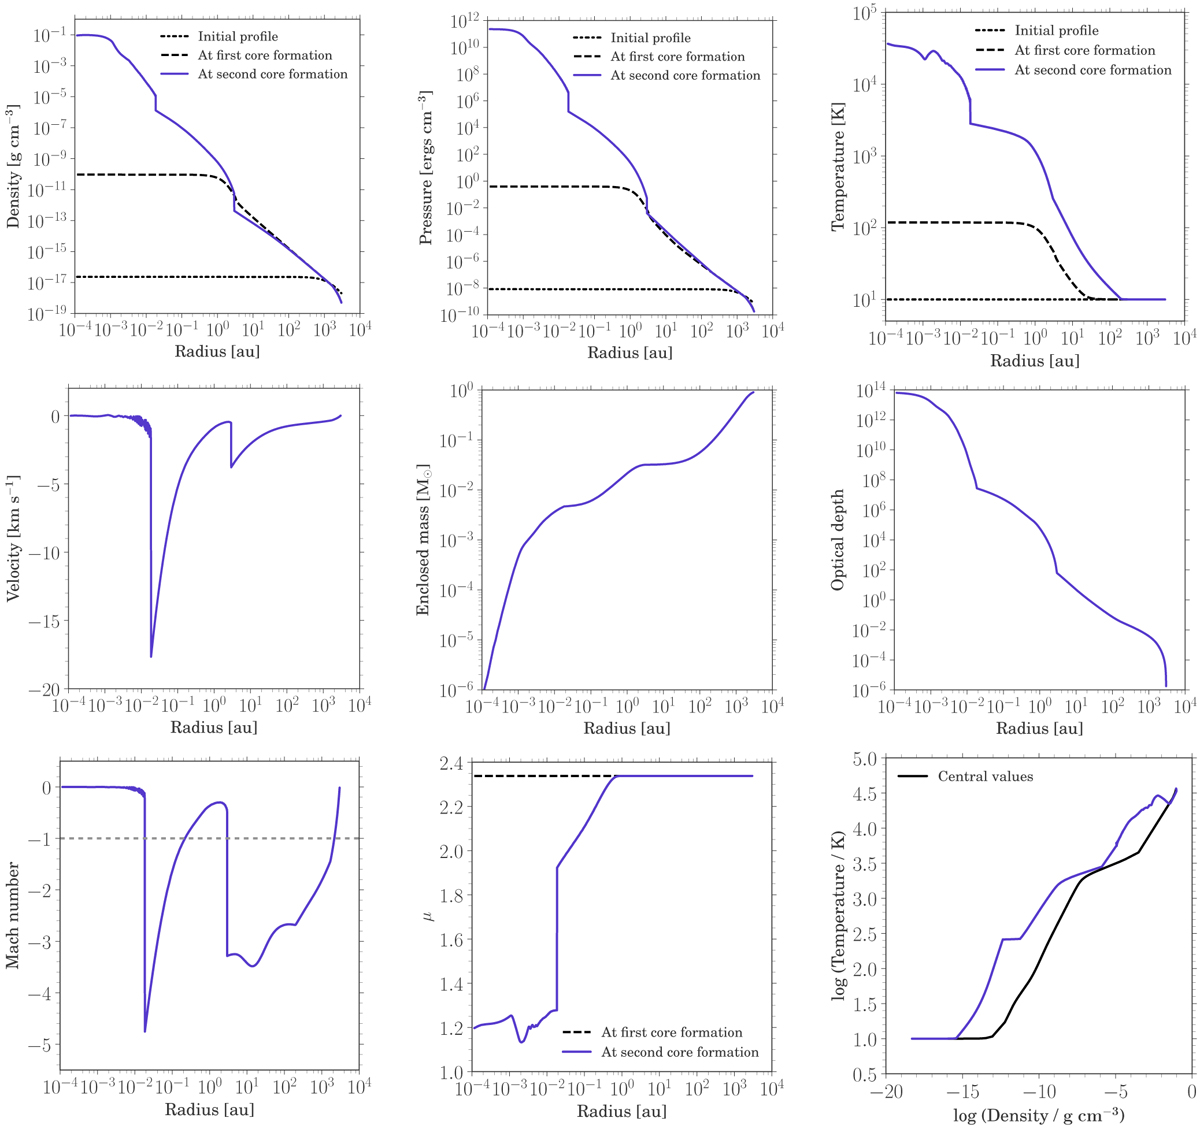
Fig. 2
Collapse of a 1 M⊙cloud. Radial profiles (across and down) of density (panel a), pressure (panel b), gas temperature (panel c), velocity (panel d), enclosed mass (panel e), optical depth (panel f), Mach number (panel g), mean molecular weight (panel h), and thermal structure (panel i) are shown at the snapshot after second core formation. The black line in panel i shows the temporal evolution of the central temperature and density. The initial profile is shown by the black dot-dashed line, the first collapse phase is indicated by the black dashed line, and the bluish purple line describes the structure after formation of the second hydrostatic core.
Current usage metrics show cumulative count of Article Views (full-text article views including HTML views, PDF and ePub downloads, according to the available data) and Abstracts Views on Vision4Press platform.
Data correspond to usage on the plateform after 2015. The current usage metrics is available 48-96 hours after online publication and is updated daily on week days.
Initial download of the metrics may take a while.