Fig. D.1
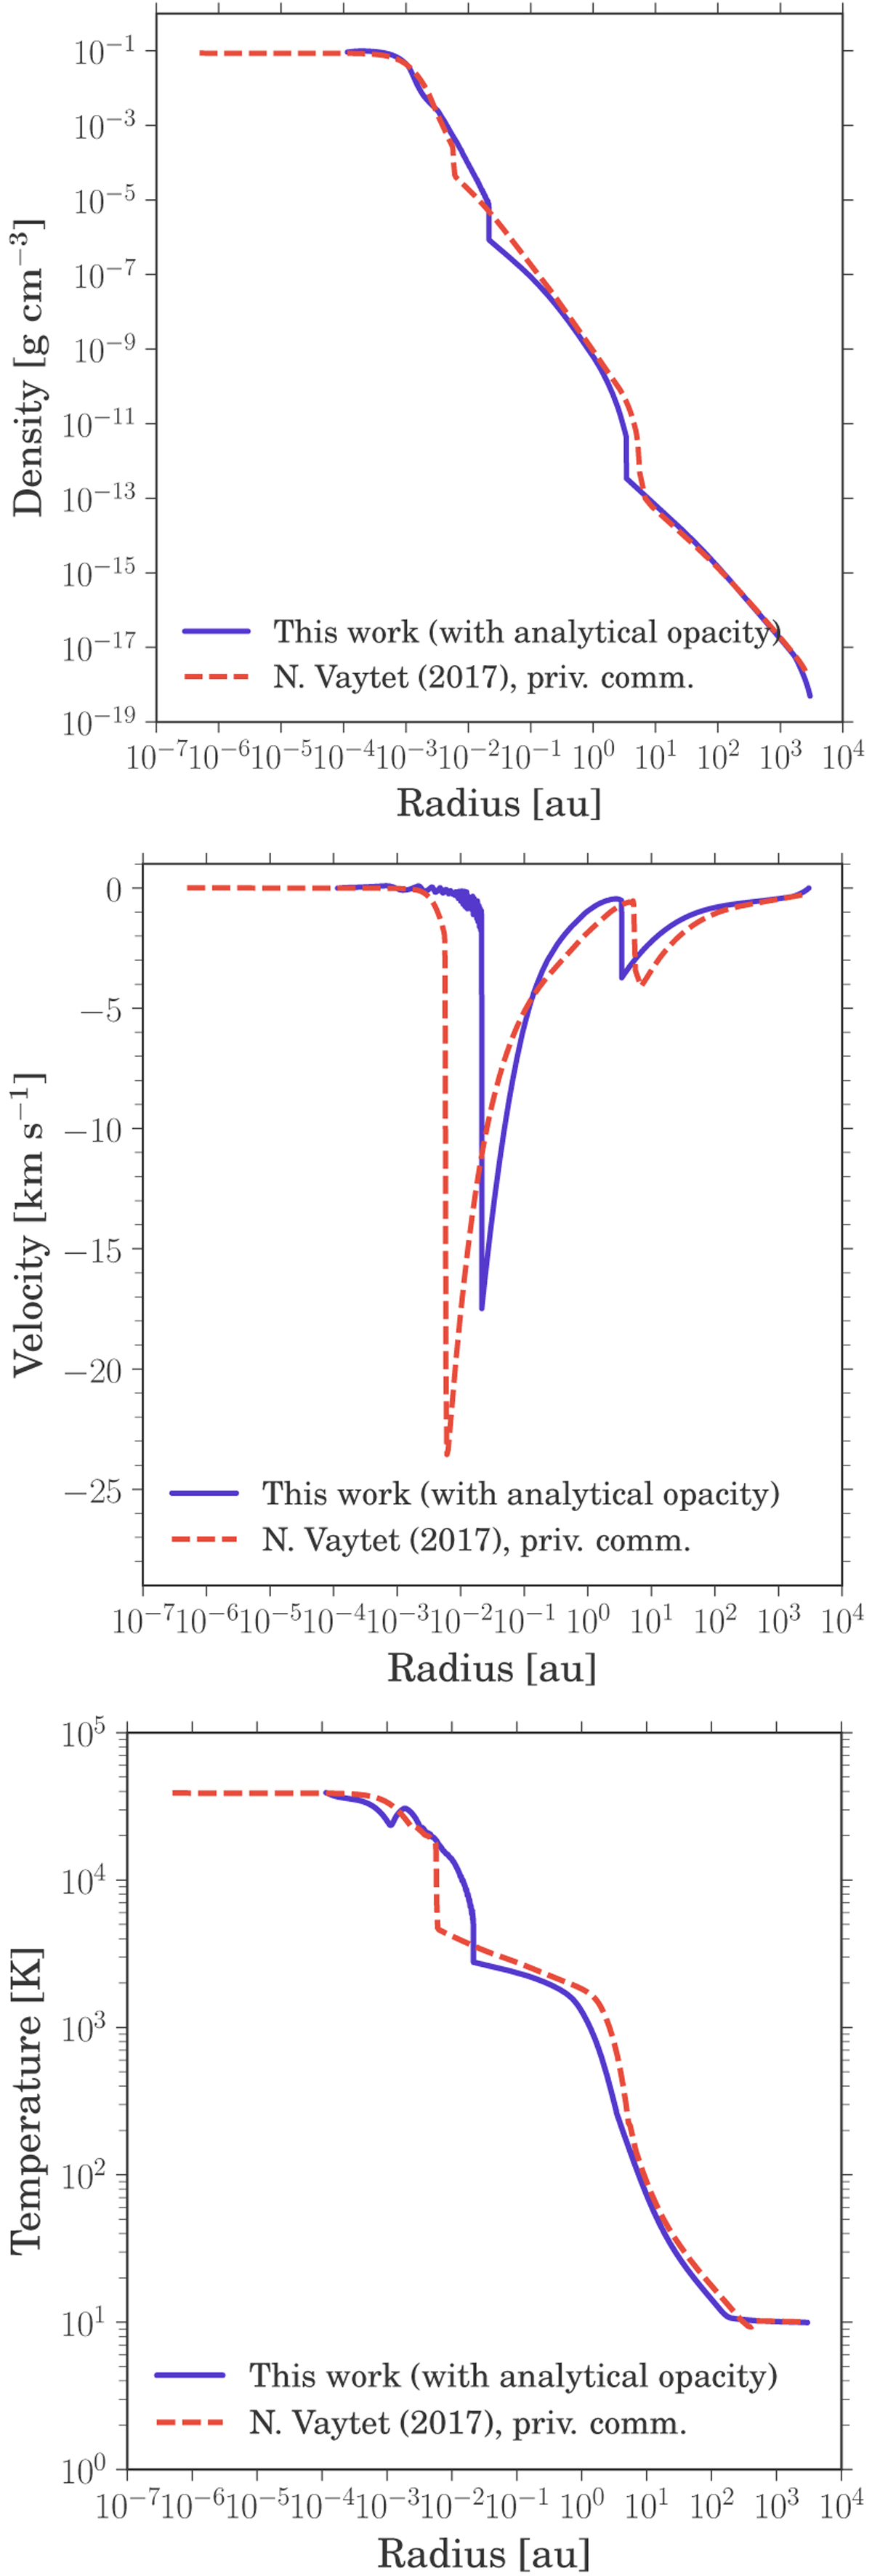
Radial profiles of the density, velocity, and gas temperature of an initial 1 M⊙ cloud at an initial temperature T0 of 10 K are shown at the time when central density ρc in both simulations reach roughly 10−1 g cm-3. The bluish purple solid lines show results from simulations described in Sect. 3, while the dashed red line represents results from simulations provided by N. Vaytet (2017, priv. comm.). We note that for this comparison both codes use the same temperature-dependent opacity ![]() .
.
Current usage metrics show cumulative count of Article Views (full-text article views including HTML views, PDF and ePub downloads, according to the available data) and Abstracts Views on Vision4Press platform.
Data correspond to usage on the plateform after 2015. The current usage metrics is available 48-96 hours after online publication and is updated daily on week days.
Initial download of the metrics may take a while.