Fig. 9
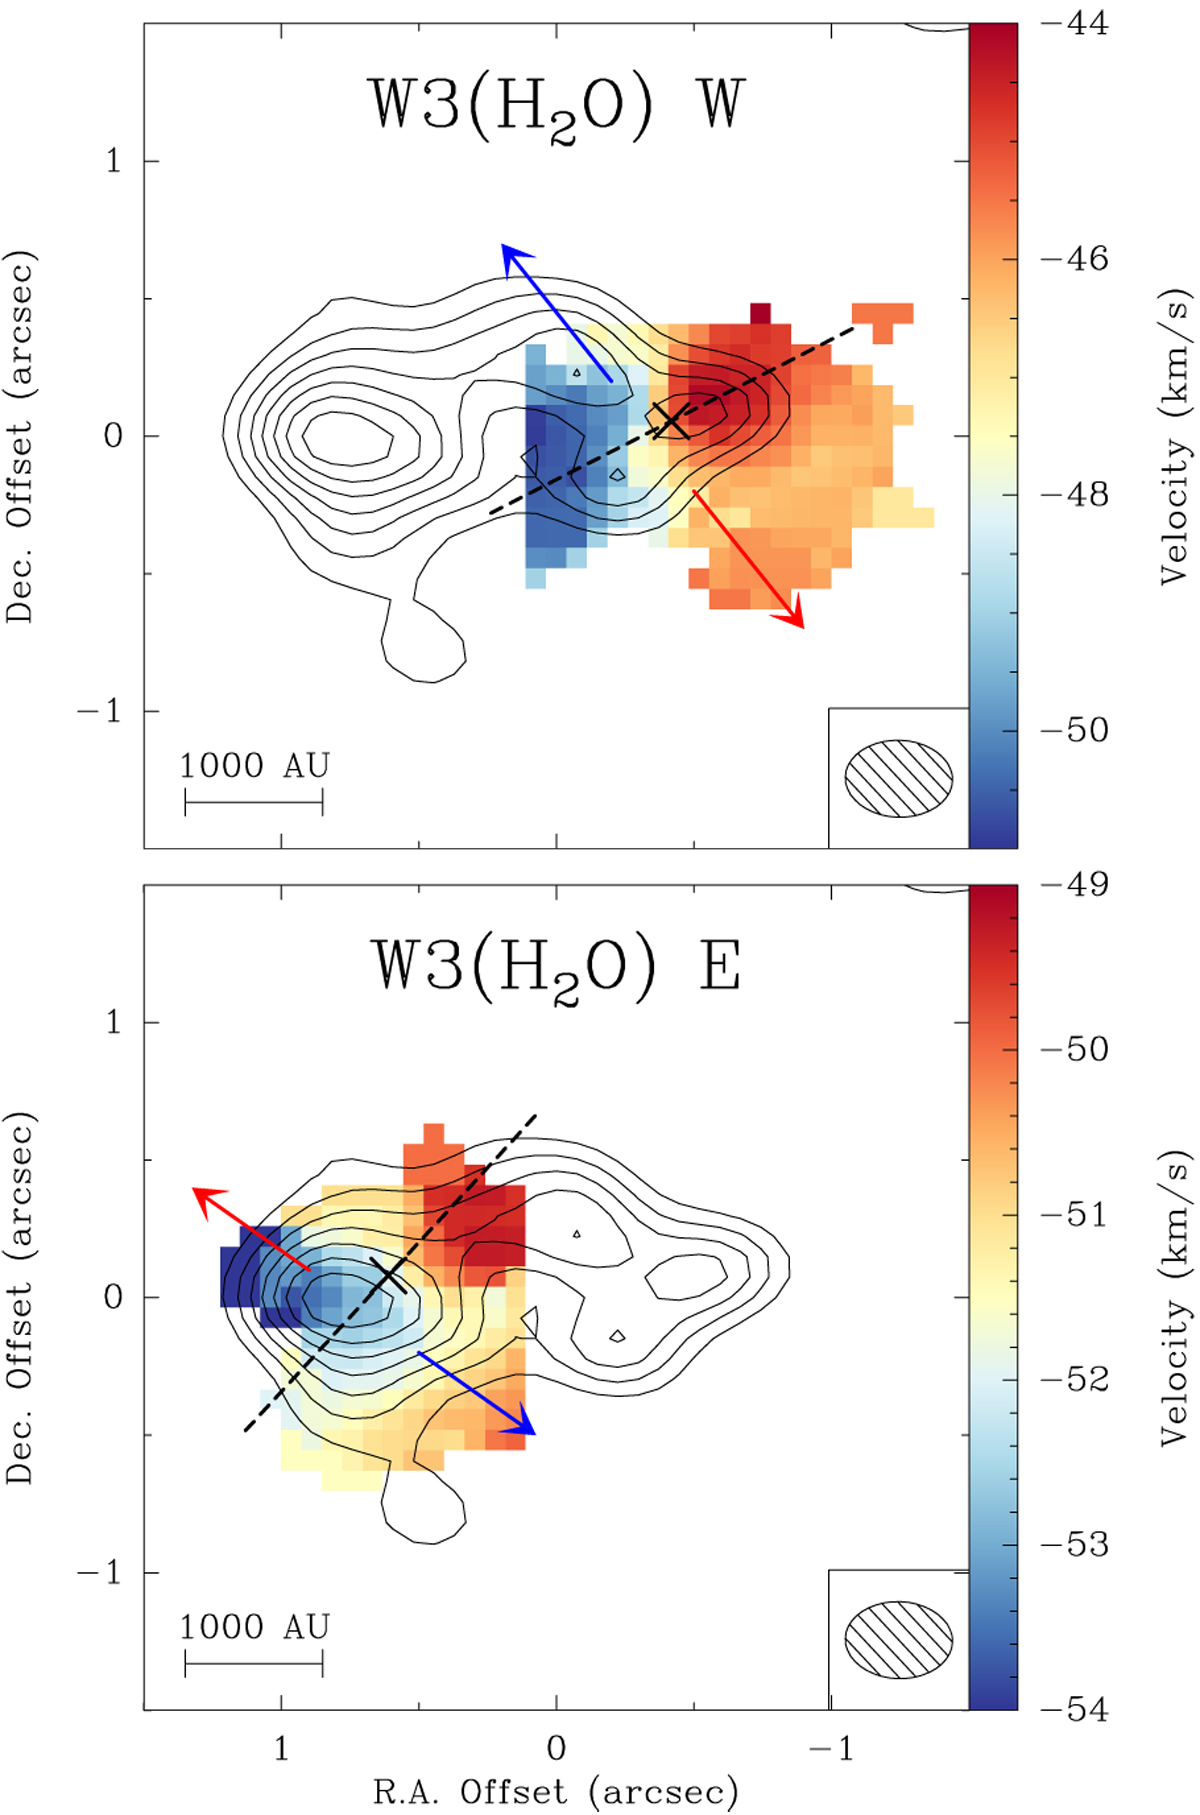
Intensity-weighted peak velocity (first moment) map of CH3CN (123−113) using only the A-array observations and masked out to show contributions from W3(H2O) W (top panel) and W3(H2O) E (bottom panel). The solid contours correspond to the 1.37 mm continuum in the A-array only observations and start at 6σ and increase in steps of 3σ (1σ = 2.5 mJy beam−1). The dashedlines correspond to the cuts made for the PV plots (Fig. 10). The blue and red arrows show the directions of bipolar molecular outflows (Fig. 6). A scale bar and the synthesised beam (0.′′ 39×0.′′28, PA = 88°) are shown in the bottom. The velocity ranges are different for the two cores.
Current usage metrics show cumulative count of Article Views (full-text article views including HTML views, PDF and ePub downloads, according to the available data) and Abstracts Views on Vision4Press platform.
Data correspond to usage on the plateform after 2015. The current usage metrics is available 48-96 hours after online publication and is updated daily on week days.
Initial download of the metrics may take a while.